Summarize Marketing and Business Data
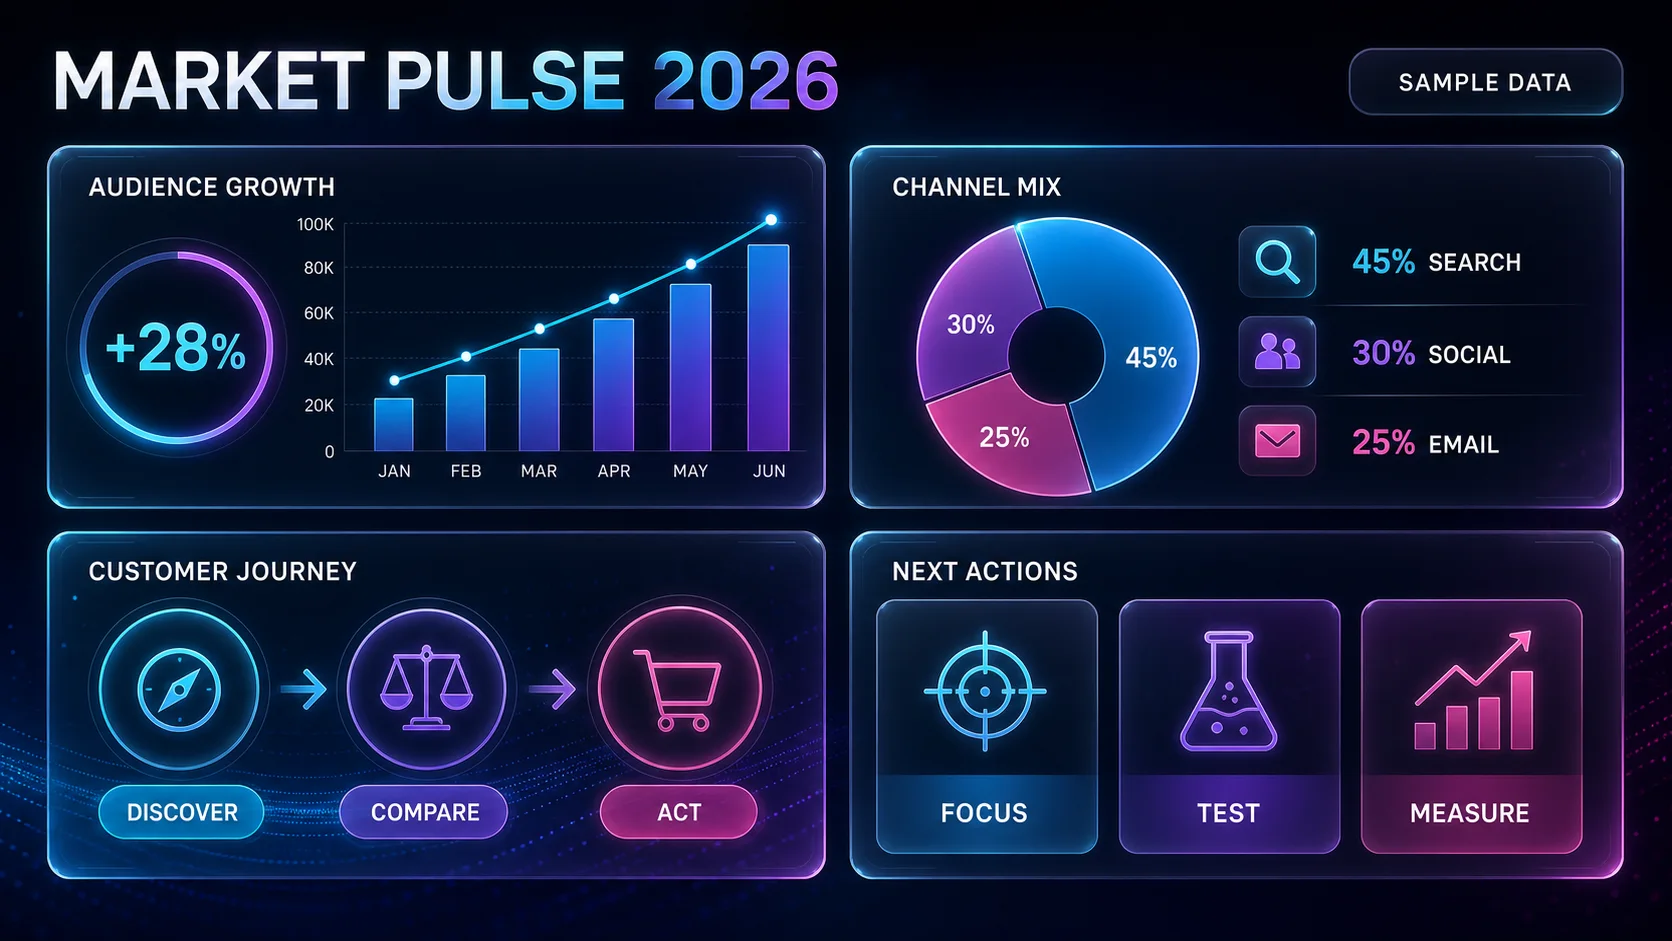
Combine exact figures, charts, highlights, and next actions in one visual narrative.
 FigEditor
AI INFOGRAPHIC MAKER FOR TEXT AND DATA
Turn notes, facts, or data into a clear infographic with an intentional reading order, exact labels, and an editable draft.
AI Infographic Generator GENERATOR
What it is
Combine exact figures, charts, highlights, and next actions in one visual narrative.
Use sequence, comparison, or cyclical structures to make the message easy to scan.
Continue revising labels, numbers, hierarchy, and reading order before export.
Research examples
Explore methodology, system, and graphical-abstract directions, then reuse the closest visual structure for your own work.
Inside the workflow
Separate content planning, visual structure, rendering, and scientific review so each iteration has a clear purpose.
Finds visual references that match the research domain.
Turns the scientific context into a concise hierarchy.
Adapts color, typography, and density to academic norms.
Renders the planned diagram or scientific composition.
Reviews faithfulness, readability, and visual economy.
Use cases
Move from an early visual hypothesis to a polished methods figure, explanatory architecture, graphical abstract, or reviewed revision.
Continue in FigEditor Studio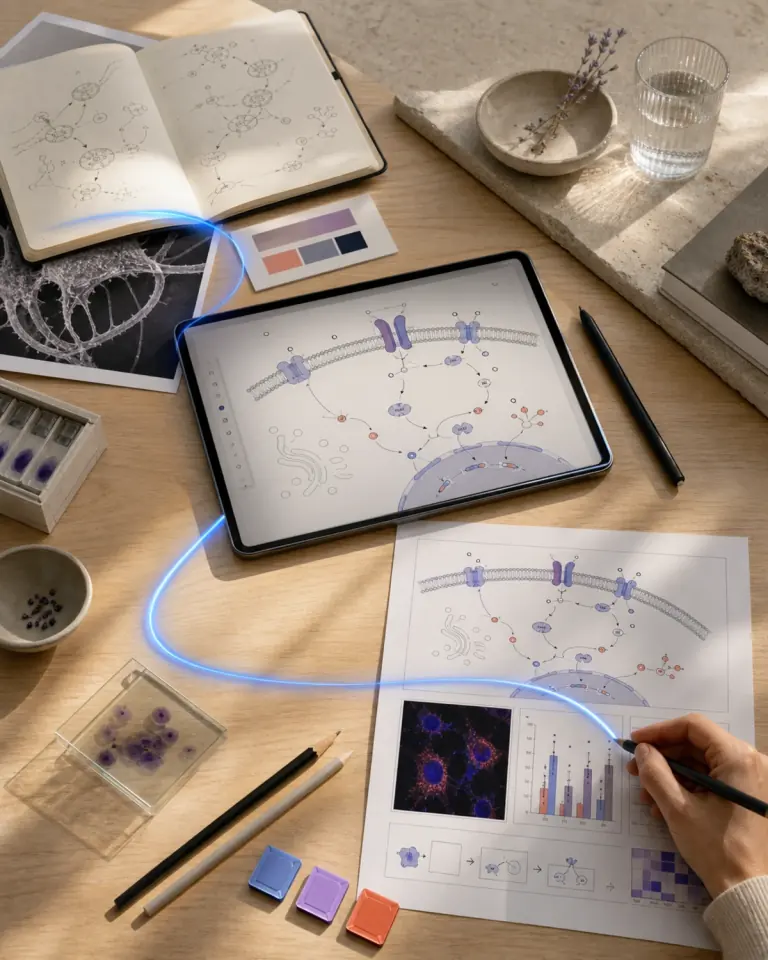
Workflow
Keep terminology, relationships, labels, and visual constraints explicit, then review the result against the source research.
Keep terminology, relationships, labels, and visual constraints explicit, then review the result against the source research.
Keep terminology, relationships, labels, and visual constraints explicit, then review the result against the source research.
Simple pricing
Choose a plan designed for the way you communicate research.
For individual researchers who need the complete visual workflow with a practical credit allowance
Start creatingFor researchers who need more iterations, commercial use, and every advanced visual workflow
Start creatingFor teams that need high-volume credits, commercial use, and support across the full workflow
Start creatingFAQ
Answers about generation, editing, credits, export, and responsible academic use.
Use a focused research brief, verify every scientific label and claim, and continue refining the generated draft in FigEditor Studio before publication.
Use a focused research brief, verify every scientific label and claim, and continue refining the generated draft in FigEditor Studio before publication.
Use a focused research brief, verify every scientific label and claim, and continue refining the generated draft in FigEditor Studio before publication.
Use a focused research brief, verify every scientific label and claim, and continue refining the generated draft in FigEditor Studio before publication.