
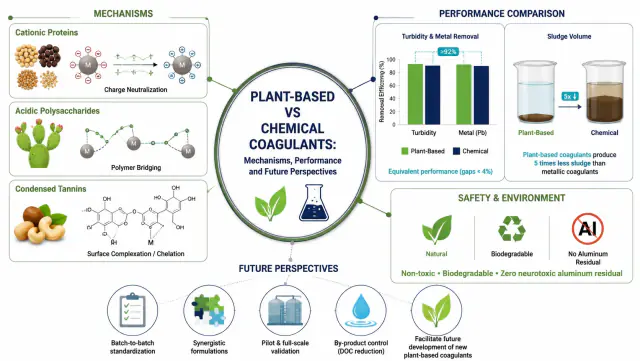
Plant-based and chemical coagulation mechanisms
Use thisAI scientific figures
Start from text, a sketch, or your own figure. Get a draft, then change labels, colors, and layout yourself.
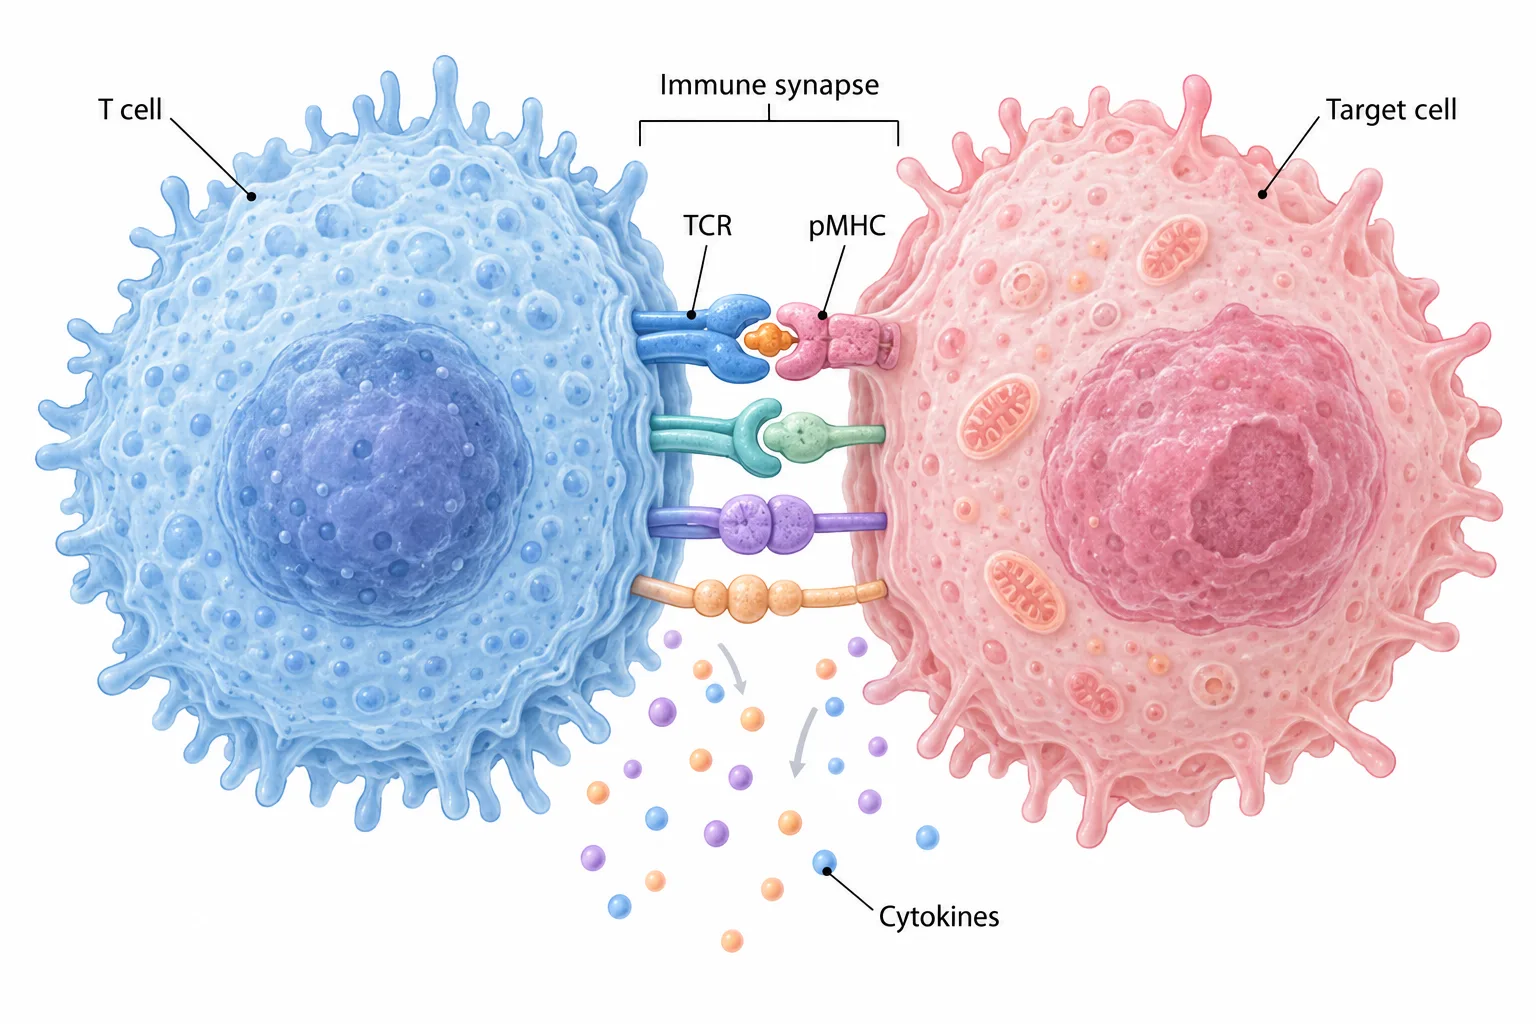
How a figure gets revised
Every result opens in the editor, so you can keep revising.
Text, a sketch, a photo, or a figure.
Check labels and arrows yourself. A new figure costs 2 credits.
Revise just one label, arrow, or color.
Every edit is versioned. Export SVG or PNG.
From text
Describe a mechanism, pathway, or method in plain words. FigEditor lays it out as a clean, labeled figure.
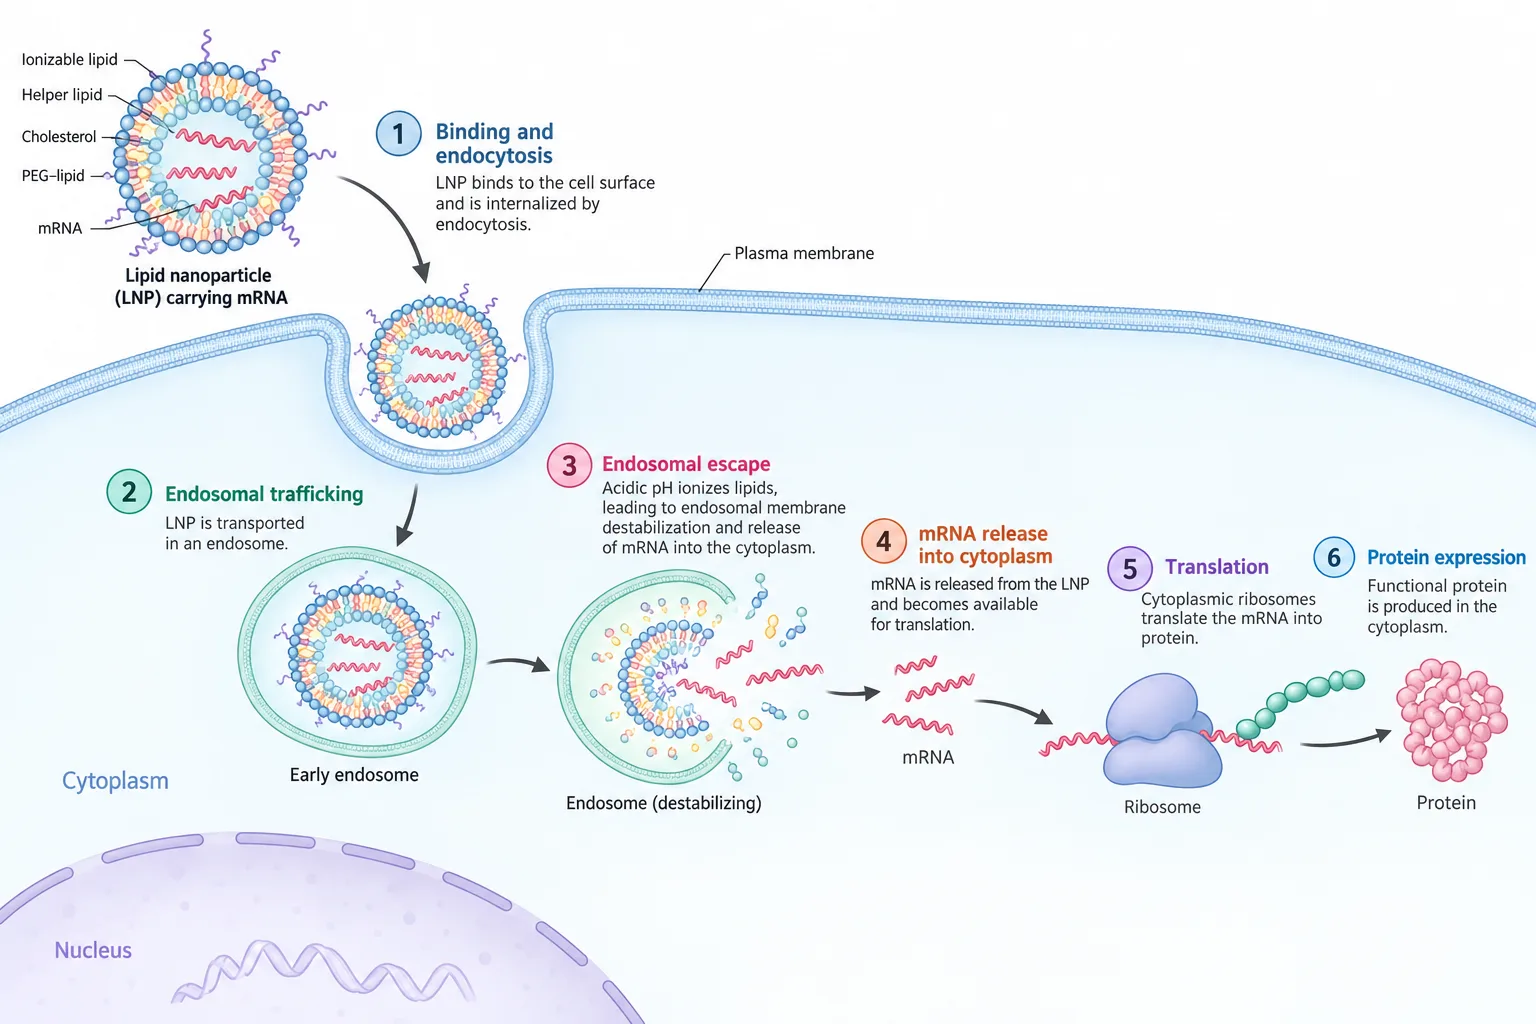
Use cases
Journal figures, slides, teaching visuals, grants and paper abstracts all start from the same place.
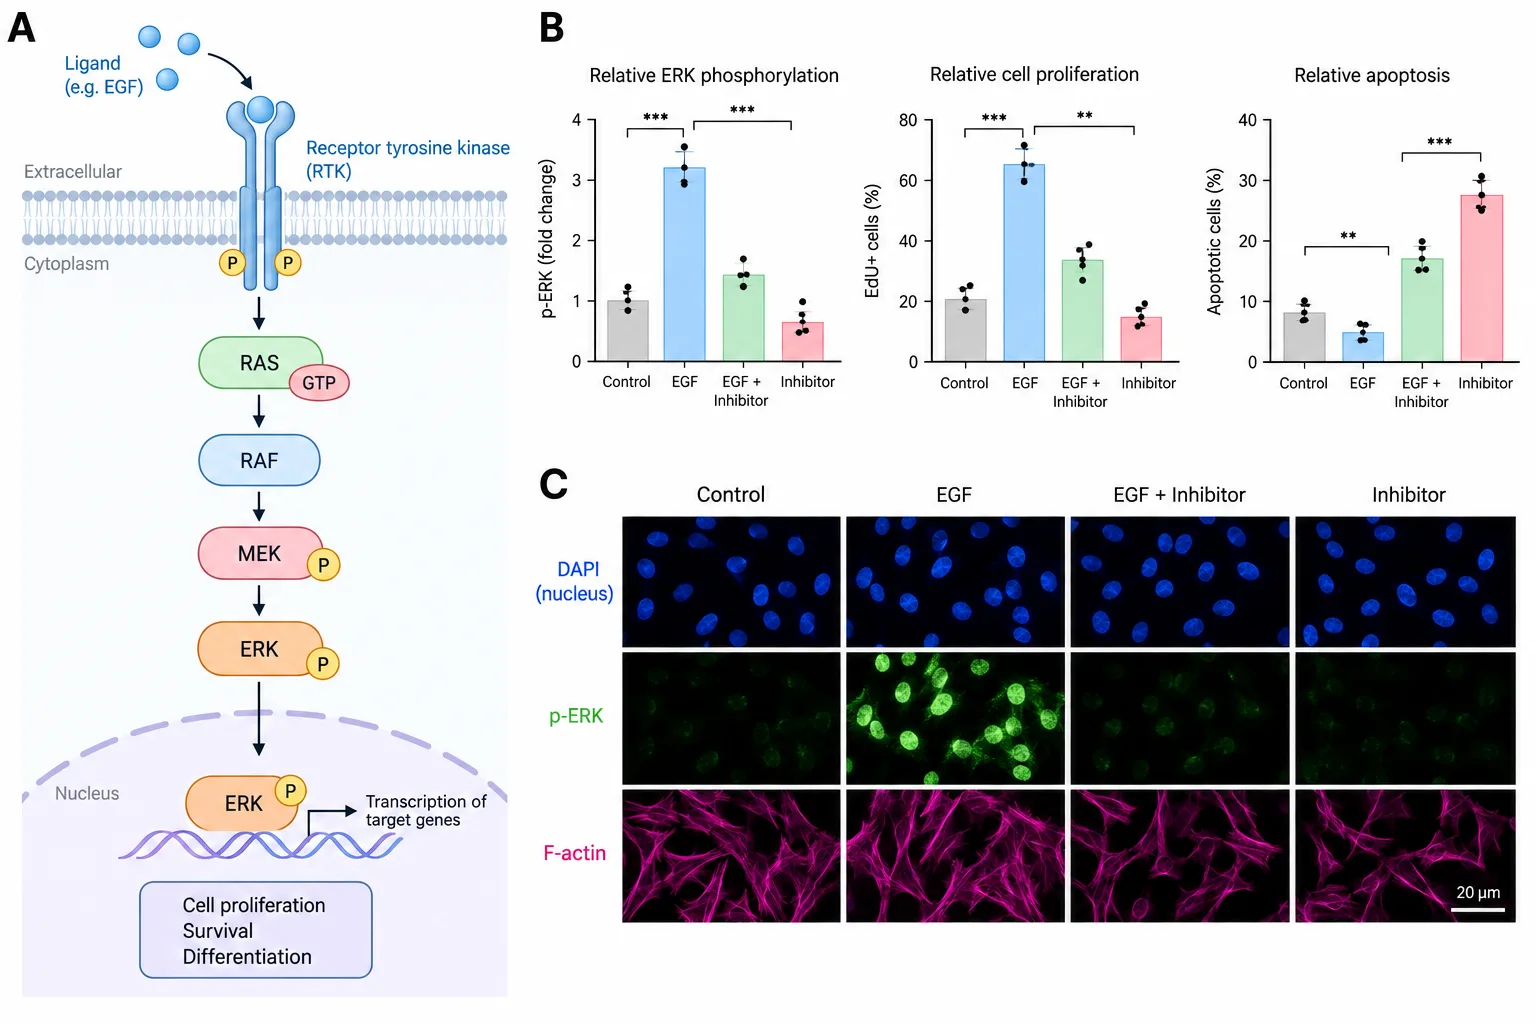
Clear, submission-ready figures that walk reviewers through complex mechanisms.
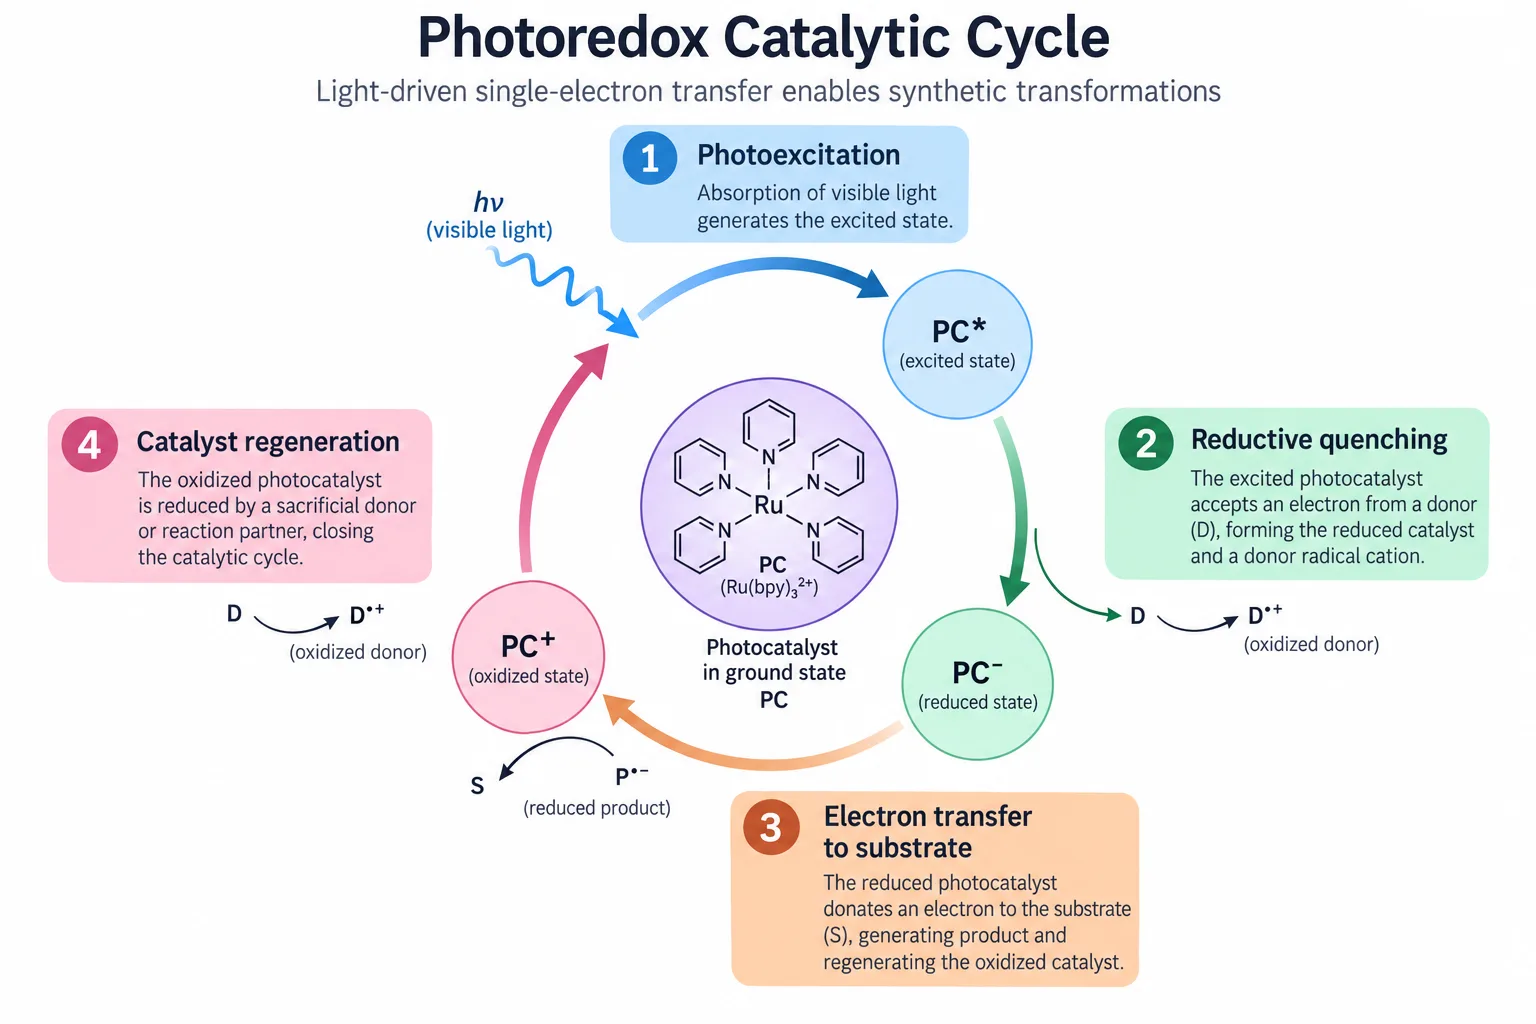
Slide figures people can read from the back row, so the finding lands first time.
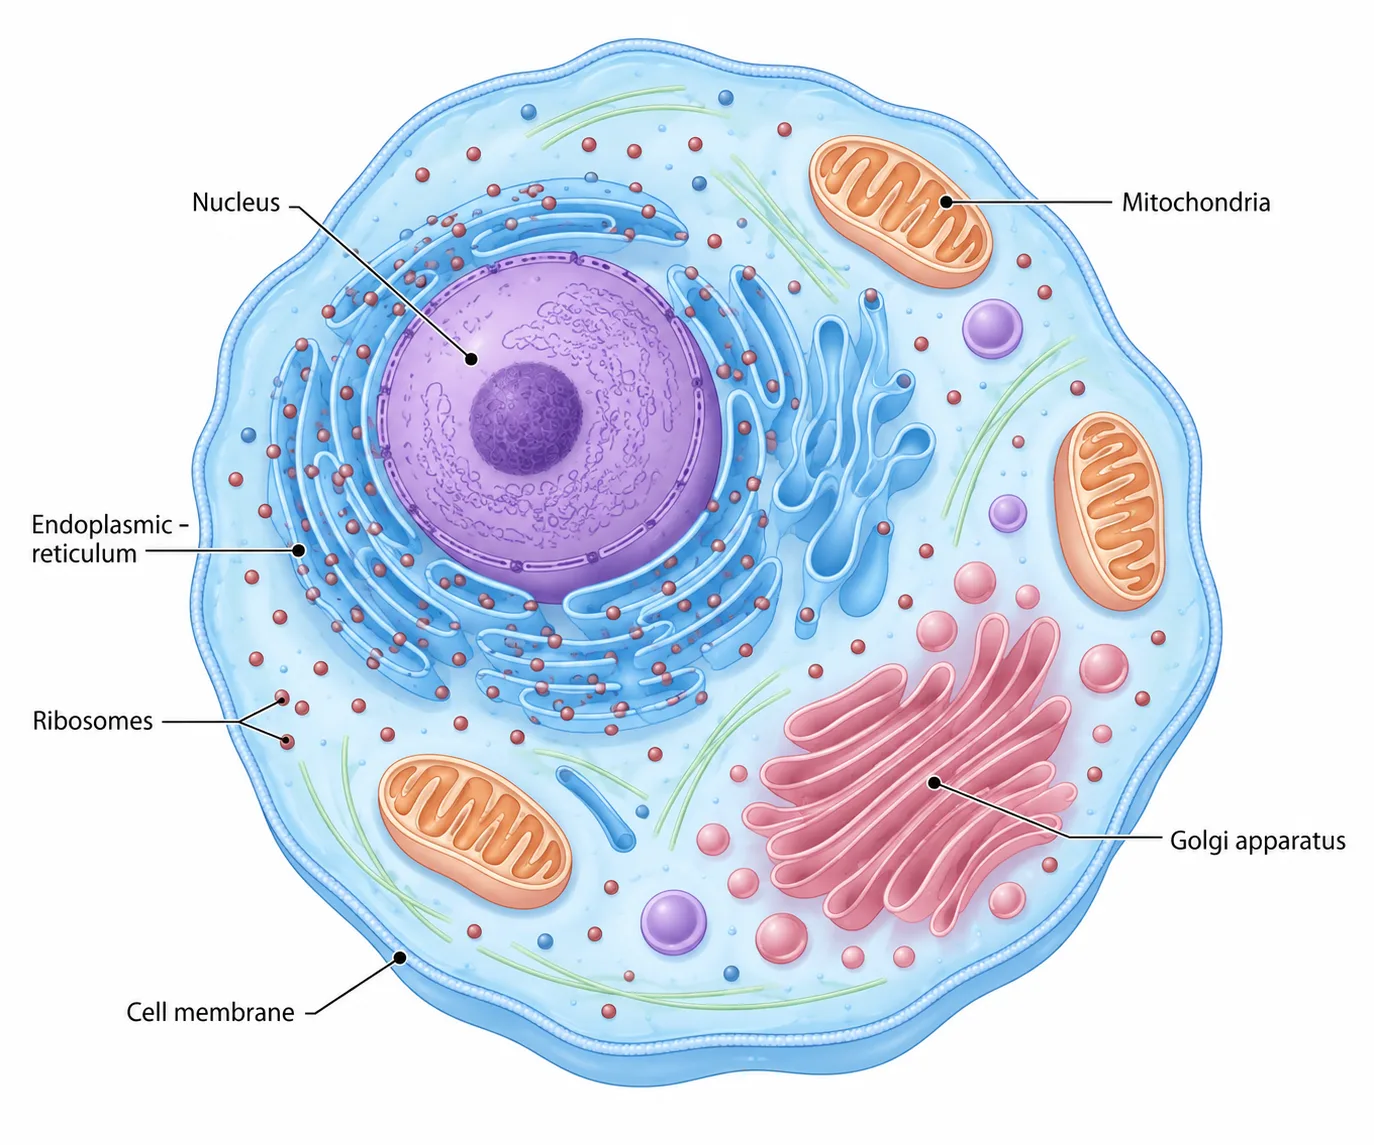
Turn abstract concepts into classroom diagrams that help students get it faster.
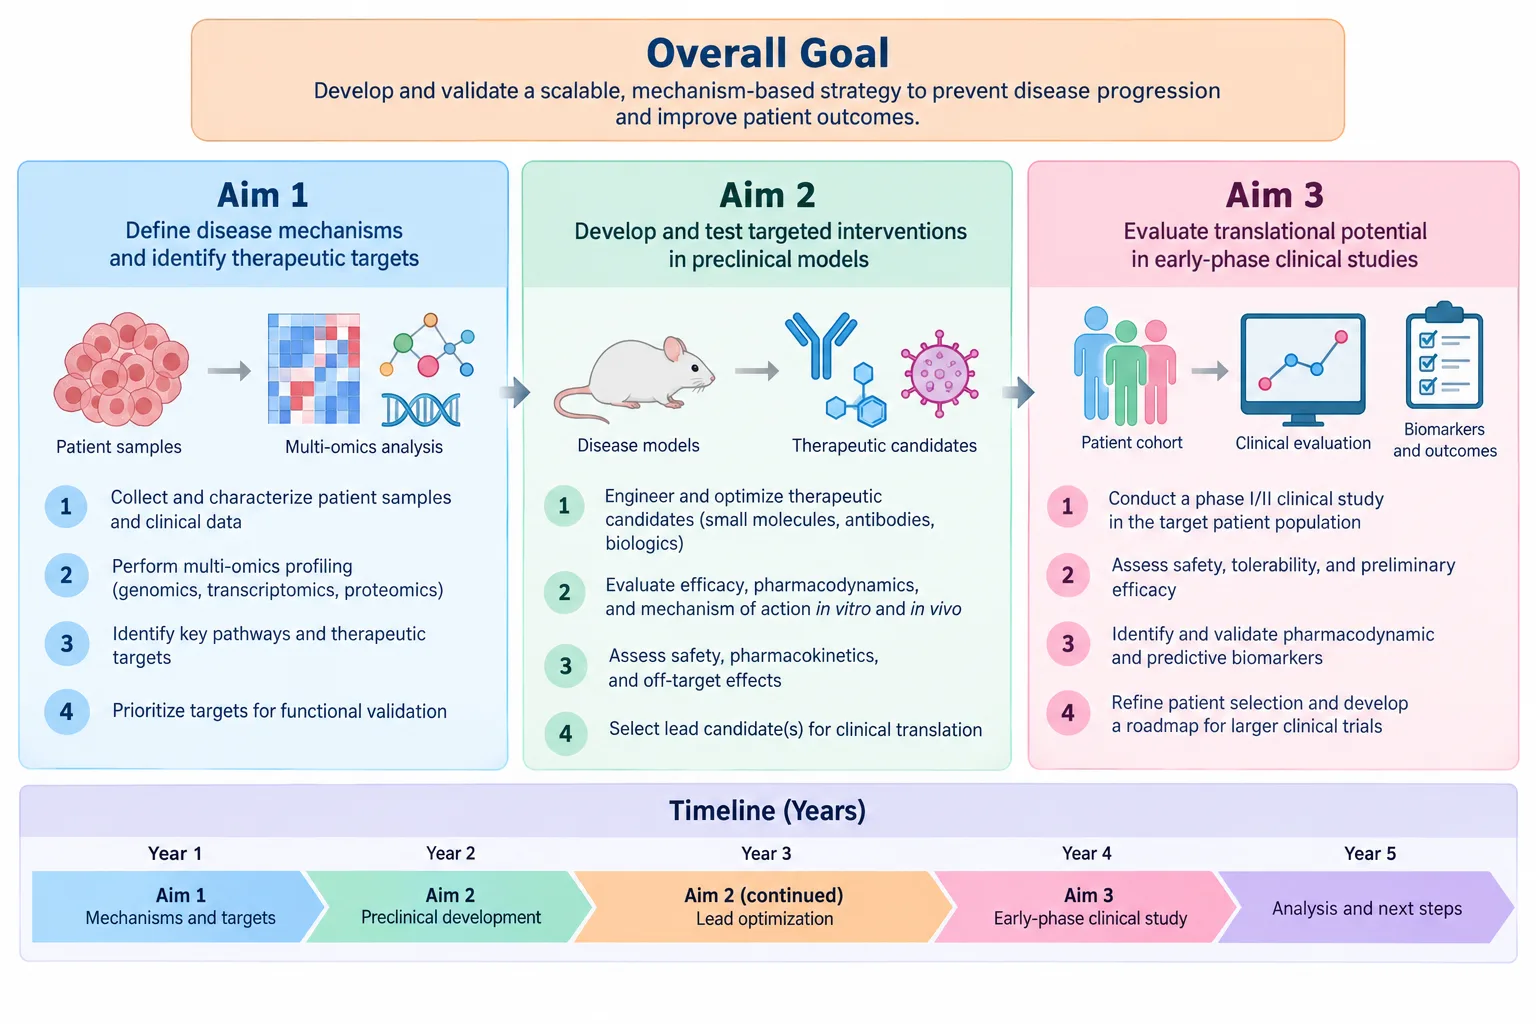
One figure that explains your aims and plan, so panels grasp the idea quickly.
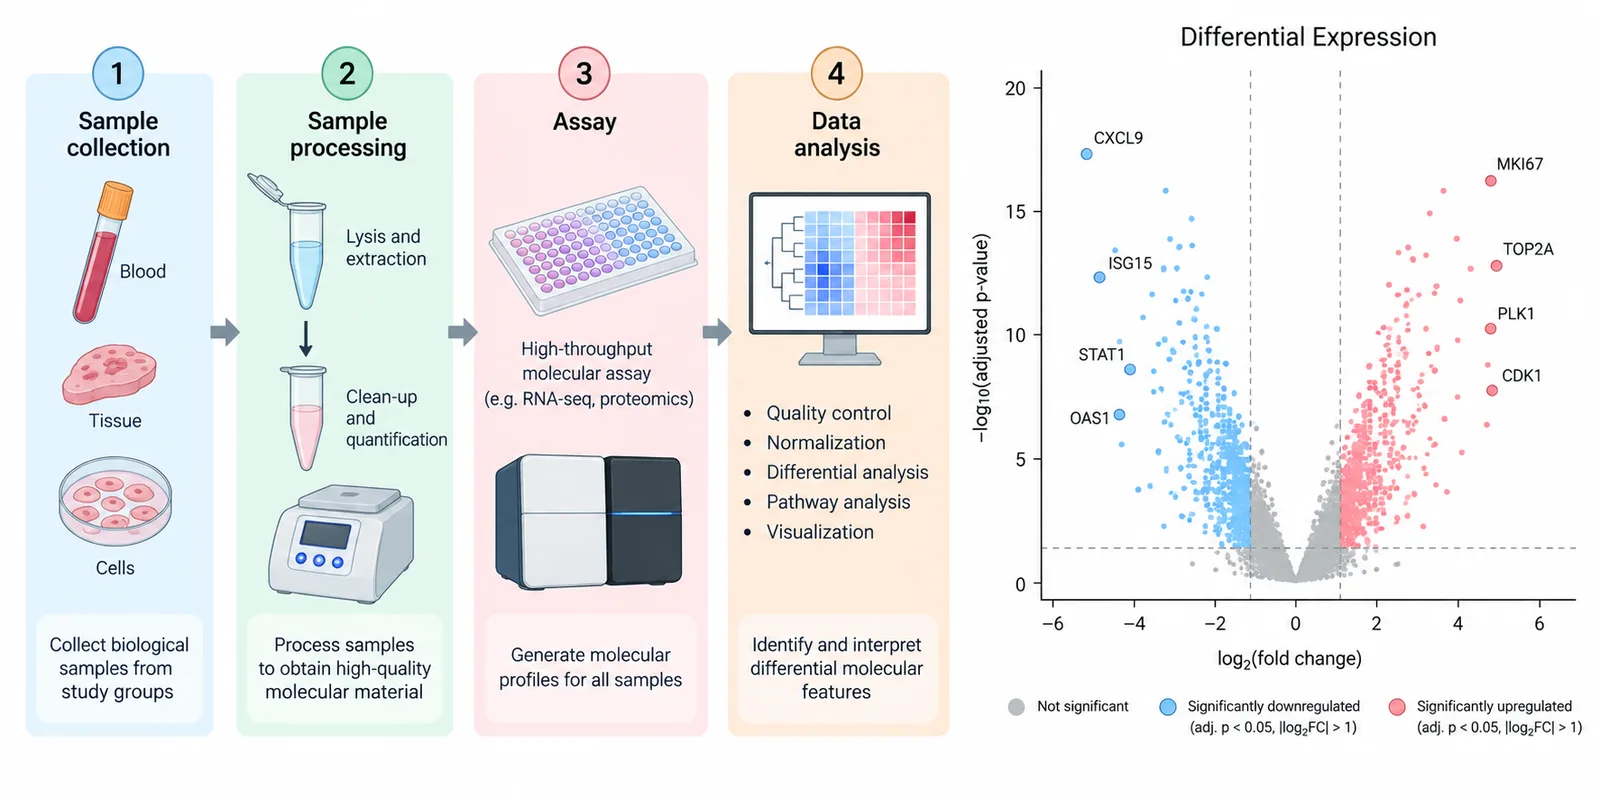
Consistent, professional figures across every chapter of your dissertation.
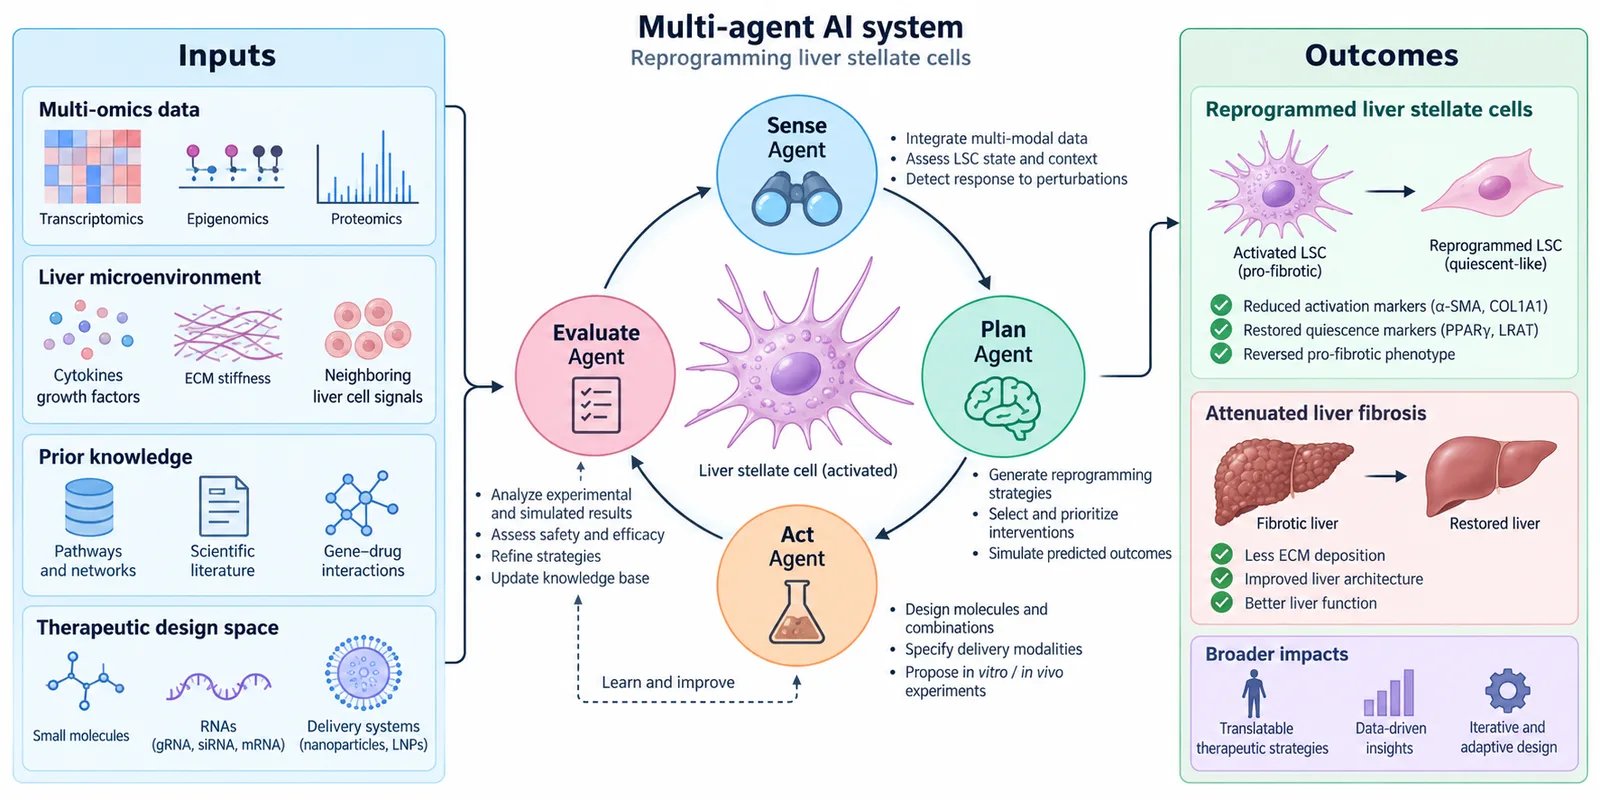
Tell the whole paper in one panel and give readers the conclusion up front.
Gallery
Layouts and styles researchers reach for most.
Hover a figure and choose “Use this” to start from it in the workspace. Your prompt stays your own.
Explore the galleryPlant-based and chemical coagulation mechanisms
Use this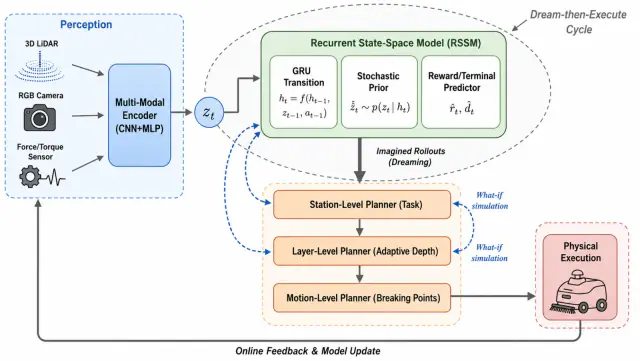
World-model robotic planning workflow
Use this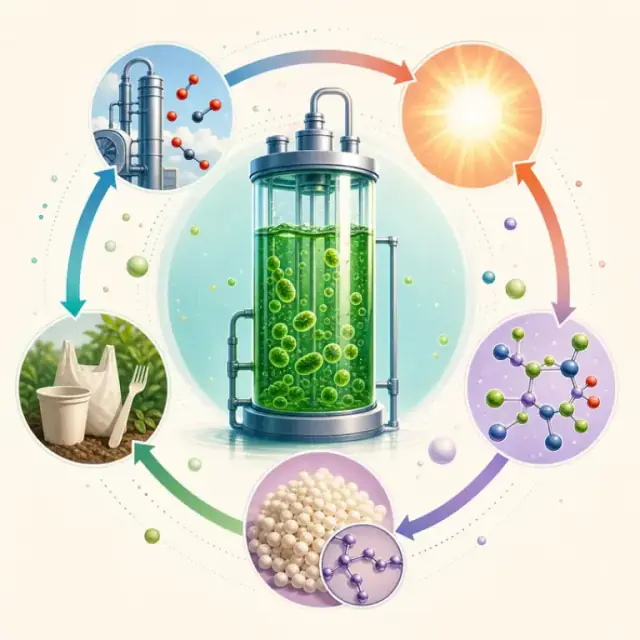
Algae carbon-to-biopolymer graphical abstract
Use this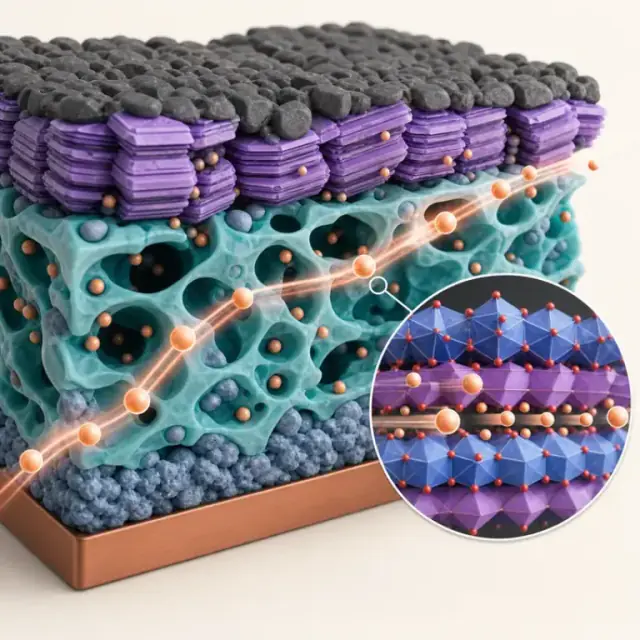
Solid-state battery electrode microstructure
Use this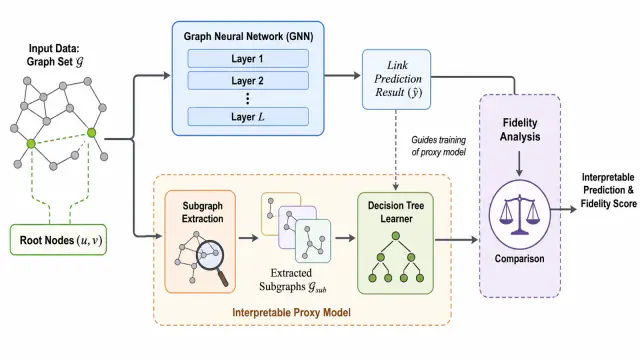
Interpretable graph neural network link prediction
Use this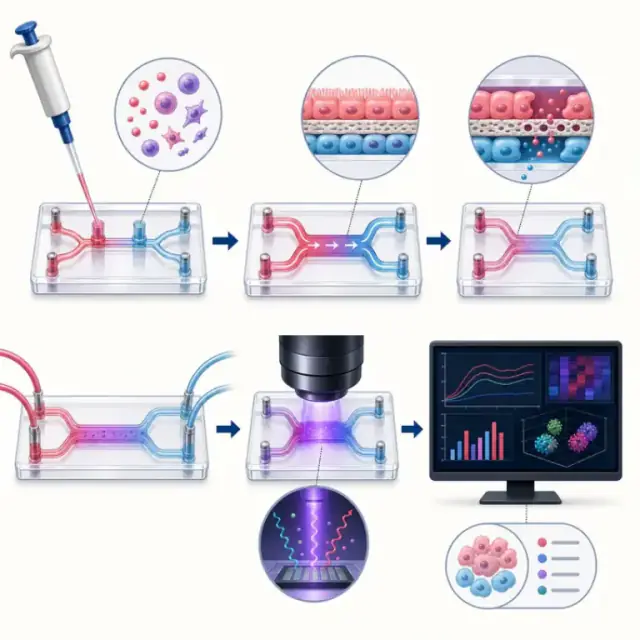
Microfluidic organ-on-chip workflow
Use this
Multimodal AI safety evaluation graphical abstract
Use this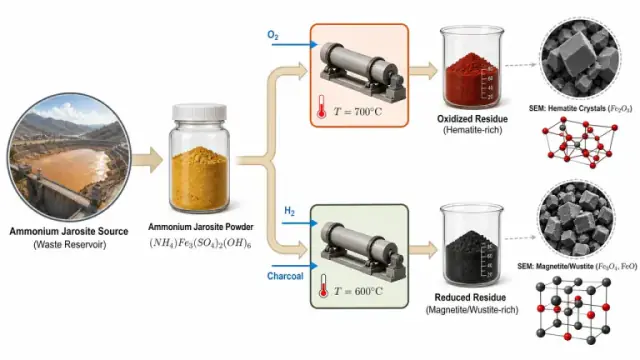
Oxidation-reduction control of iron-oxide microstructure
Use thisFAQ
What researchers ask before their first figure: credits, editing, export formats, and how to check a generated draft.
Boxes, arrows, and handwritten labels are enough. FigEditor keeps your layout and relationships and redraws them cleanly.
Yes. Pick an aspect ratio for a journal column, a single abstract panel, or a 16:9 slide before you generate.
No. It borrows composition and visual language as guidance, while the content comes from your own prompt.
PNG at the resolution you generated, plus editable SVG through the vectorizer. Exporting larger does not add detail that was not generated.
Select any region to revise labels, arrows, colors, or modules without starting over. Every change is versioned.
Yes. Check your target journal’s policy on AI-assisted figures and disclose use where required.
Yes. Exported SVG files open in PowerPoint, Illustrator, Inkscape, and Figma. Shapes stay editable; labels the converter reads confidently become text, and the rest stay as vector shapes.
Each generation or edit uses a fixed number of credits shown before you run it. Failed generations are refunded.
Still have questions? Contact us
Researchers use FigEditor to make figures they can edit and export.
Start my research figure