
Research figures, with room to revise
Build a graphical abstract around one research message
Connect the research question, approach and finding in a compact visual story rather than reproducing the whole paper.

Inspect the output before editing: generated regions may be raster images, and tracing does not recover the original drawing objects or guarantee editable labels.
What a graphical abstract is
A graphical abstract is a single self-contained visual that summarises one paper: the question, the approach and the result, readable without the surrounding text. Journals show it in tables of contents and on article pages, where it competes for attention against dozens of neighbouring entries.
Because it condenses rather than reports, a graphical abstract is a selection problem before it is a drawing problem. Decide the takeaway first; the layout, the symbols and the labels all exist to serve that one message.
- One take-home message
- A reader should be able to state the finding after a few seconds of looking at the figure.
- A single reading direction
- Left to right, top to bottom or clockwise: commit to one path and keep every arrow on it.
- A small label vocabulary
- Reuse the same word for the same entity and keep abbreviations identical to the paper.
Figure examples
Browse figure examples
Layouts and styles researchers actually use. Open any of them in the workspace as a visual reference and write your own prompt.
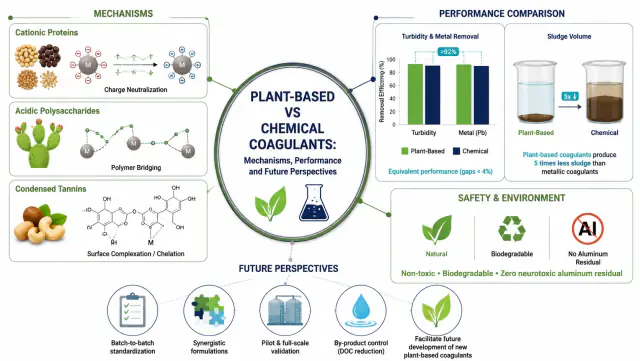
Plant-based and chemical coagulation mechanisms
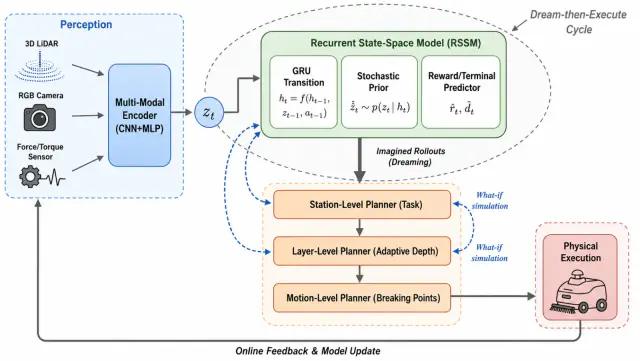
World-model robotic planning workflow
Algae carbon-to-biopolymer graphical abstract
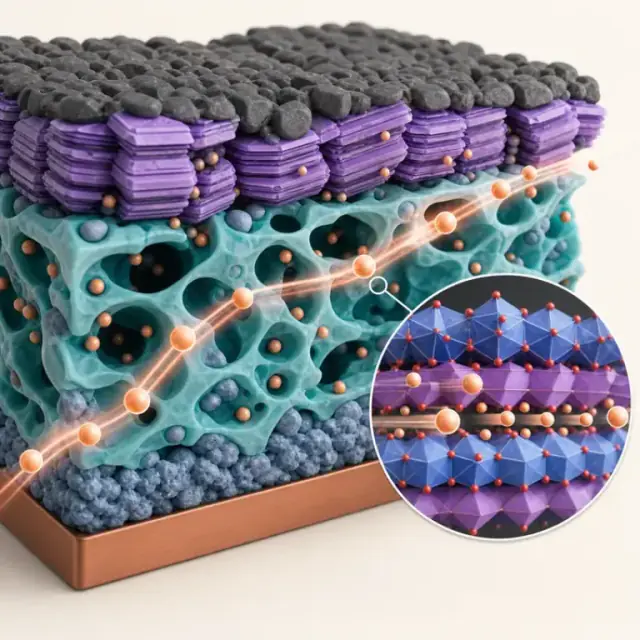
Solid-state battery electrode microstructure
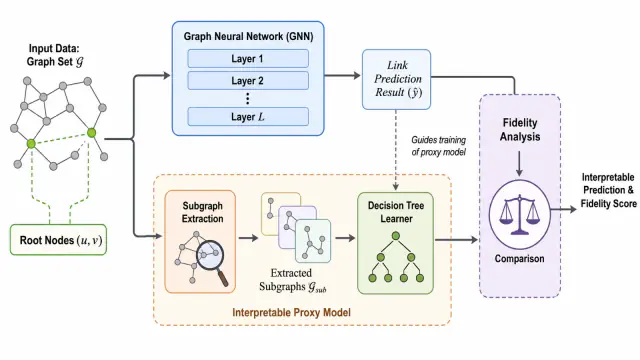
Interpretable graph neural network link prediction
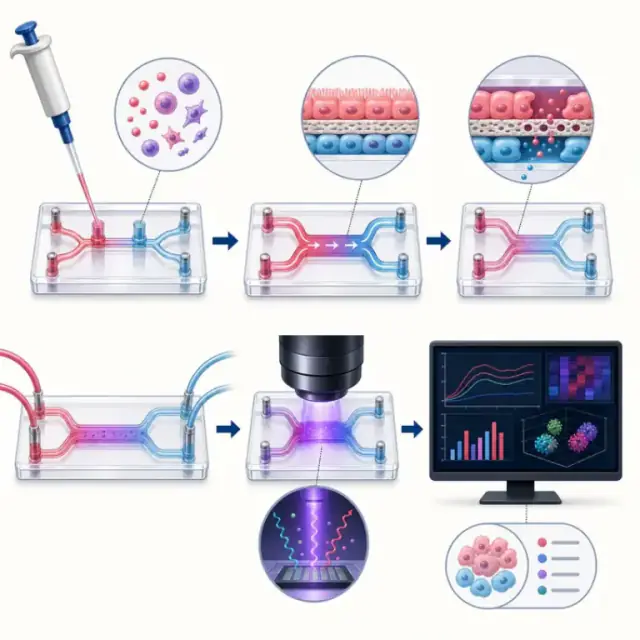
Microfluidic organ-on-chip workflow

Multimodal AI safety evaluation graphical abstract
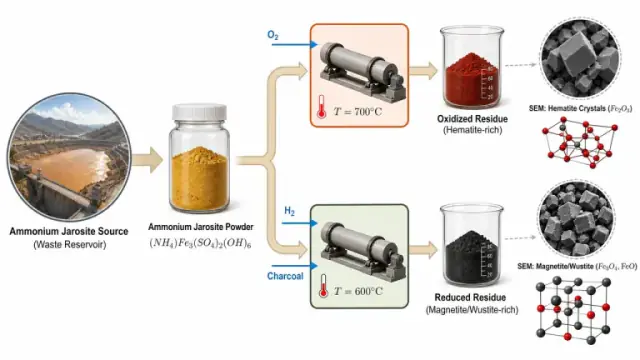
Oxidation-reduction control of iron-oxide microstructure
Draft first, correct second
Generate the first version of the figure, then fix labels, arrows and emphasis in the editor instead of drawing the whole panel again.
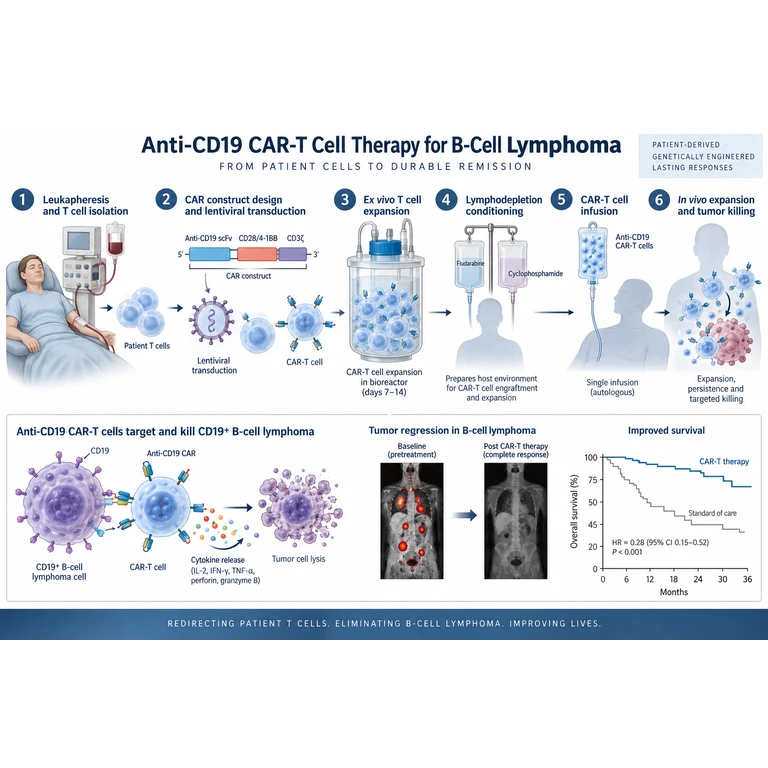
Keep the versions you compare
Every generation and edit is saved, so you can weigh two directions and return to an earlier draft without rebuilding it.
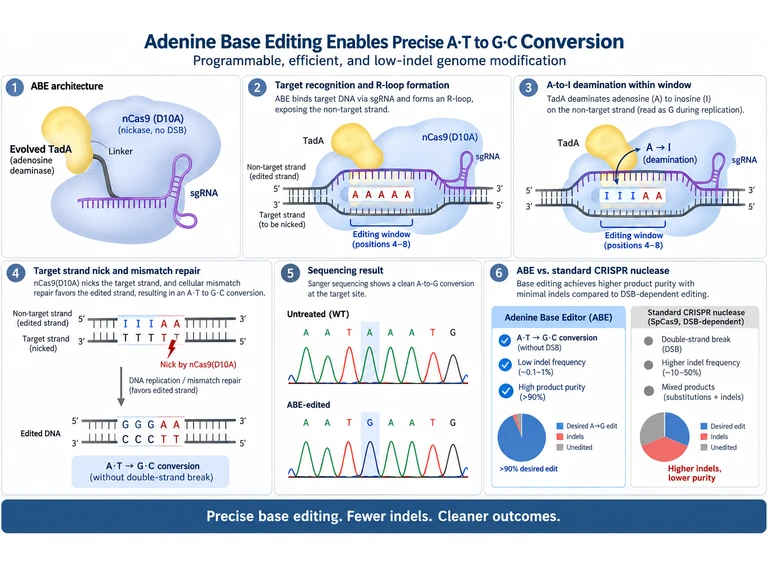
Export something you can still edit
Take a high-resolution PNG for a draft or an editable SVG when the figure still has to change inside PowerPoint, Illustrator or Figma.
Common mistakes that get graphical abstracts sent back
Reproducing the whole paper
A graphical abstract that lists every step and condition becomes unreadable at thumbnail size. Cut it to the finding and the shortest route to it.
Labels that shrink with the panel
Text that is legible in the editor can disappear at published size. Zoom out to the space the journal will actually give the figure.
Ignoring the journal's own rules
Size, file type, font list and colour requirements are set per journal. Read the current author guidelines before designing, not after.
Graphical abstract size and format by journal
| Setting | What applies | Why it matters |
|---|---|---|
| Dimensions | Many journals publish a recommended aspect ratio or minimum width rather than one exact pixel size. | Work at the aspect ratio the journal specifies so the composition does not have to be rebuilt later. |
| File type | Vector artwork is usually preferred; raster is often accepted at a stated resolution. | Export SVG from the editor and keep a high-resolution raster version as a fallback. |
| Text in the artwork | Some publishers rasterise the image and expect no text below a minimum size. | Check the smallest label at the size the journal will publish. |
| Colour | Colour restrictions and colour-blind-safe palettes vary by publisher. | Avoid encoding meaning in colour alone; add a shape or label difference as well. |
Requirements are set by each journal and change over time, so confirm them against the current author guidelines for your target.
A workflow you can inspect
Define the research brief
List the entities, relationships, labels and visual emphasis. Add only research information you can support.
Review the draft
Compare the generated figure with your evidence. Correct terminology, missing steps and misleading relationships.
Refine and export
Continue with the editor and inspect the downloaded file before using it in a paper or presentation.
FAQ
Questions before you start
Can I bring a reference or sketch?
The generation workspace accepts a research description and reference images. Use references you have permission to use and review the resulting interpretation.
Is the result scientifically verified?
No. A generated draft needs review by someone who understands the research, including labels, directions, units and claims.
What should I prepare before generating?
List the entities, the relationships between them, the reading direction and the labels you need. A clear brief makes the first draft faster to check.
Where do I go after the draft?
Review the draft in the workspace, then adjust labels and shapes in the editor and export the version you have verified.
How do I choose a tool?
For an existing bitmap, use SVG conversion. For an existing vector file, open the SVG editor. For a new research visual, start with the generation workspace.
Ready to start on your next figure?
Bring a description, sketch or reference image into the workspace and finish the draft yourself.