
Plan a Scientific Figure Before Assembling It in Canva
Separate scientific content, panel assembly and exported-file review instead of treating a polished layout as a finished figure.
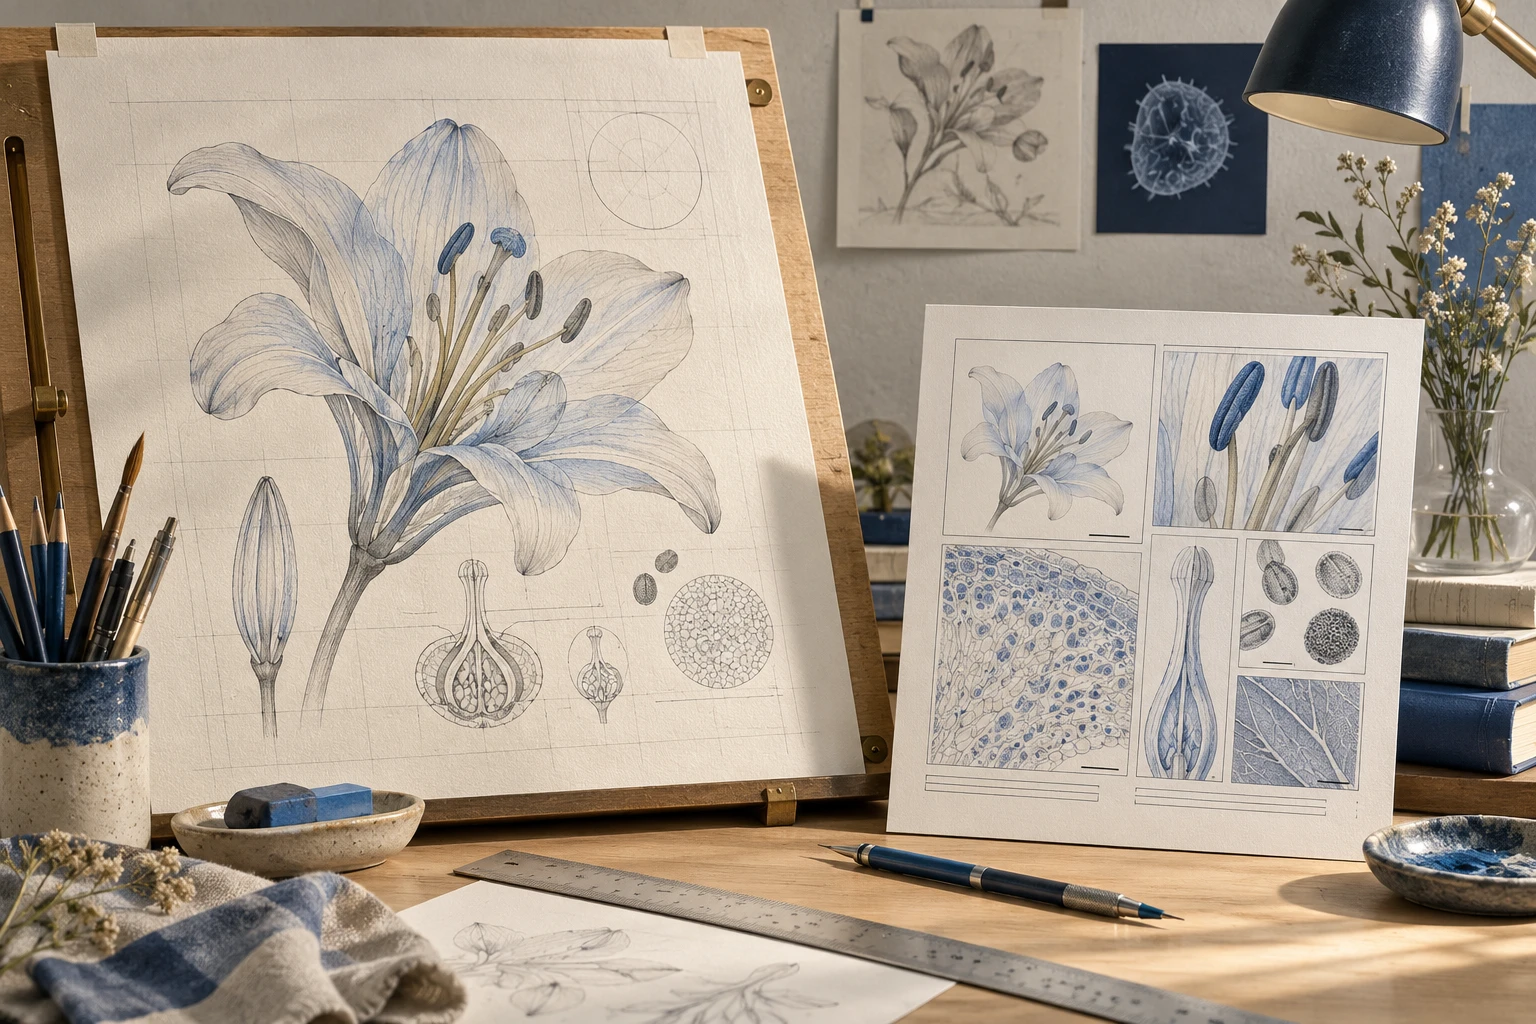
Canva can be part of a scientific presentation workflow, but a layout tool cannot recover missing microscopy detail or validate a generated pathway. Consider a two-column figure containing a micrograph, a quantitative plot and a short explanatory schematic. The useful question is whether the delivery preserves each source correctly.
Start with the physical destination
For a hypothetical 183 mm-wide figure with a 5 mm inter-column gap, each column is 89 mm before margins. At 300 DPI, that column requires approximately 89 / 25.4 × 300 = 1,051 pixels across. Use your journal’s actual specifications; 300 DPI is an example, not a universal rule.
| Panel | Keep as the source | Check after layout |
|---|---|---|
| Micrograph | Original analysis export | Crop, scale bar and source pixels |
| Quantitative plot | Plotting-software output | Axis labels, values and uncertainty |
| Conceptual schematic | Reviewed artwork | Connections and label readability |
Use Canva for the task it is actually doing
The Canva download guide distinguishes PNG, SVG, PDF Standard and PDF Print and describes account restrictions for some options. Choose the intended format deliberately. A PDF Print setting does not turn a small embedded image into a detailed source.
Keep a copy of the micrograph before placing it. Set its size from the physical destination, then inspect it at the final viewing scale. Avoid stretching one axis independently: that changes the apparent morphology.
A concrete revision exercise
Create two equal panel regions. Place the micrograph in the left region and the plot in the right. Add independent labels A and B. Then swap their positions and change B to C while preserving the image aspect ratios and scale information.
Export a viewing copy and open it outside Canva. Check whether the smallest axis label is readable. If a collaborator needs object edits, also test the offered editable handoff rather than assuming a presentation or SVG export contains editable plot data.
Treat crop privacy as a file-level check
Canva’s guide warns that a PDF containing cropped images may retain the original image. For sensitive material, cropping in the layout is not enough. Create a deliberately redacted source image first, verify it, and use that copy in the design. Preserve the unredacted research original securely outside the delivery package.
This is relevant to patient information in a screenshot, notes around a scanned graph, or identifying labels at the edge of a photograph.
When to use a different component
Use analysis software for quantitative plots, an object editor for precise paths/text, and a layout workspace for final panel assembly. FigEditor can draft conceptual artwork and assemble reviewed panels, but does not replace data analysis. Keep the scientific sources, editable master and final review copy as separate files.