
Build a Research Figure Around One Clear Claim
Plan panels, labels and evidence before generating a visual draft, then keep a reviewable master for revisions.
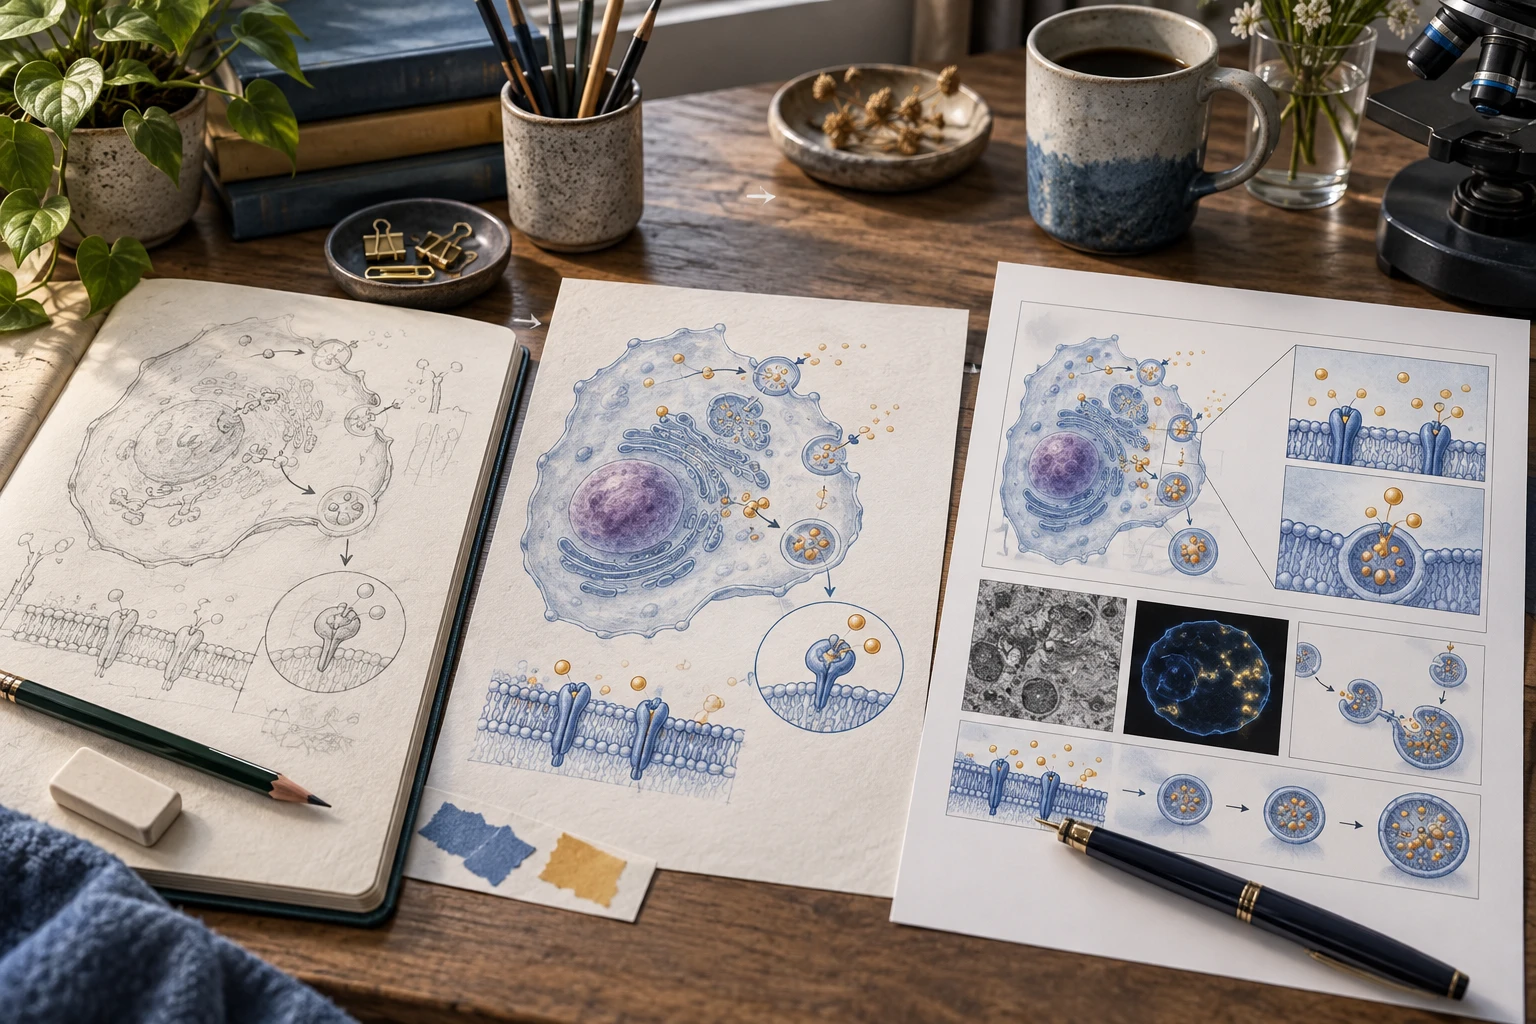
Build a paper figure around the statement the reader should retain. In this worked example, the statement is: “A filtration workflow separates the preparation procedure from its measured recovery.” The example is fictional; its dimensions and sample values illustrate planning rather than a validated experiment.
Reserve a different job for each panel
Use panel A for the workflow: Input sample → Filter → Collected fraction. Use panel B for the measured recovery, plotted from your analysis. Use panel C only if a separate validation or limitation needs to be shown. Do not generate a decorative chart to fill unused space.
Draft panel A with this bounded brief:
Create a left-to-right explanatory workflow with three objects labelled Input sample, Filter and Collected fraction. Arrows mean transfer of material, not improved performance. Use a plain container silhouette and a distinct filter symbol. Do not add numbers, a recovery curve, a molecular mechanism or an efficiency claim. Leave labels large enough to replace manually.
The brief is an untested example. Generate a draft in the figure workspace, then compare the output with the three-object inventory. If it introduces a fourth stage or reverses a transfer, correct the structure first.
Calculate the layout before shrinking the labels
For a hypothetical 180 mm wide delivery area, reserve two 5 mm gaps for three equal panels. Each panel receives (180 − 2 × 5) / 3 = 56.7 mm. A two-panel layout with one 5 mm gap gives 87.5 mm per panel. The extra width may be more useful than a redundant third panel.
For raster export, pixel width = physical width in inches × pixels per inch. A 180 mm composition at 300 ppi needs about 2,126 pixels: 180 / 25.4 × 300. That calculation does not guarantee that every embedded photograph has sufficient detail. Check each source image separately. At 600 ppi the composition needs about 4,252 pixels, and a small embedded image is still small original data.
These are examples, not universal journal requirements. Set the actual delivery size and resolution from the destination's instructions.
Keep the recovery calculation outside the image model
If the fictional input mass is 10 mg and the collected mass is 7.5 mg, recovery = 7.5 / 10 × 100 = 75%. Record the measurements and calculation in a spreadsheet or analysis script. A single illustrative value does not supply replicates, uncertainty or statistical evidence; do not invent error bars.
Place the resulting chart beside the schematic in the figure layout tool. Label the diagram as schematic and describe the measured quantity in the chart caption. This keeps visual explanation separate from the analytical result.
Apply a revision test to the master
In the SVG editor, change “Collected fraction” to the wording in your protocol, move the filter and check both arrow endpoints. Reopen one exported copy in the receiving application. Inspect clipping, fonts and line thickness at the intended physical size. Retain the data-derived chart source as well as the diagram master.
Before handoff, ask a reviewer three concrete questions: Does panel A depict the actual procedure? Can panel B be reproduced from the supplied data? Does the caption explain every simplification? A figure is ready for submission preparation when those answers are documented and the target journal's current format and AI-use rules have been checked.