
How to Write an IMRaD Research Paper: A Figure-First Workflow
A figure-first IMRaD workflow that links research questions, methods, figures, results, and discussion, with a final manuscript consistency check.
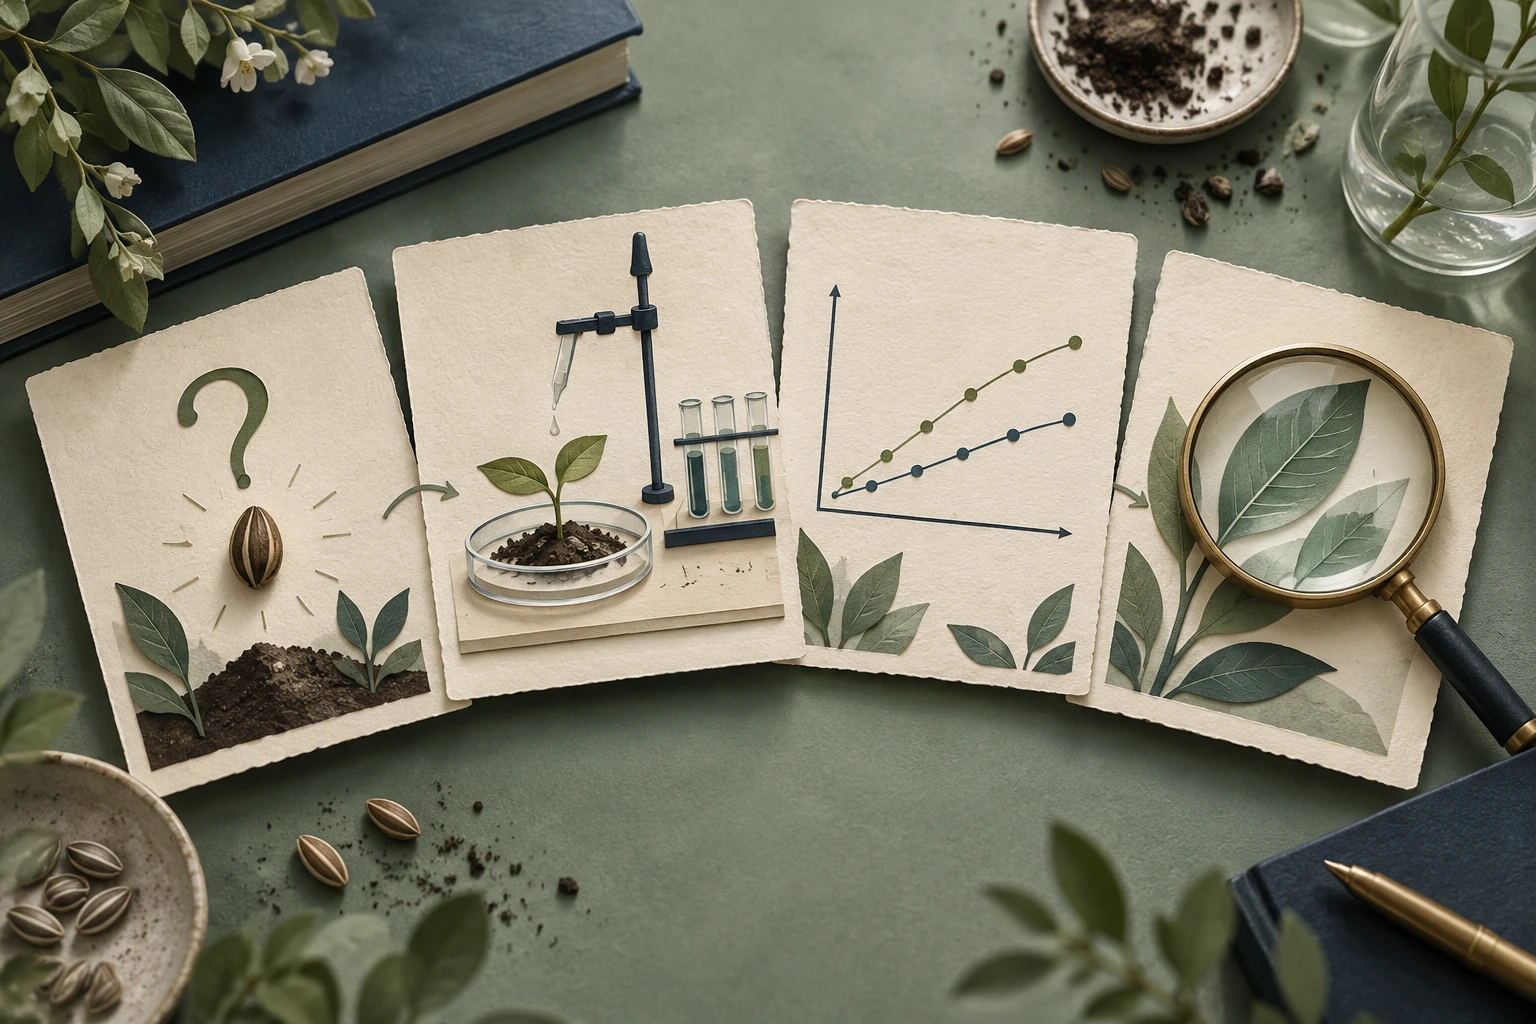
IMRaD (Introduction, Methods, Results, and Discussion) is the standard skeleton for many empirical papers. A figure-first workflow means you decide what evidence the paper needs to show, and what each figure must prove, before the prose becomes long and hard to restructure. Figures expose gaps in logic much earlier than paragraphs do.
Why start with figures?
Prose can hide a weak argument behind fluent sentences. A figure cannot: either the comparison is shown or it is not. Drafting figures first gives you:
- a visible chain from question to evidence
- early warning when an analysis is missing
- a Results section that is organized around findings, not around the order experiments happened to be run
- fewer rewrites, because the structure is settled before paragraphs are polished
This does not mean final figures come first. It means rough versions of the figures, even sketches, come first.
Step 1: Build a question and evidence map
Make a simple table with one row per claim you intend to make.
| Research question | Claim | Design and variables | Analysis | Evidence (figure/table) |
|---|---|---|---|---|
| What does the study ask? | What will you say? | Samples, groups, measures | Tests or models | Panel that shows it |
Rules for the map:
- Every claim needs at least one piece of evidence.
- Every figure panel should support at least one claim; a panel with no claim is a candidate for the supplement or for deletion.
- Write claims in the cautious form the data permit. If a result is suggestive rather than conclusive, say so here, not just in the Discussion.
Step 2: Draw the Methods workflow
Next, sketch the study as a workflow: inputs, major steps, decision points, controls, and outputs. This is useful twice. It helps readers follow the Methods, and it gives you stable names for each stage that you can reuse across the paper. A methods flow diagram built from your own protocol text can make a good draft, but you must still check each step against what was actually done.
Pay particular attention to:
- inclusion and exclusion steps and how many samples remain after each
- the order of operations when order matters
- which steps produce which data, since that link feeds the next step
Step 3: Map every Results panel back to a Methods step
For each result panel, write down the step in the workflow that produced it. A simple notation works well: "Fig. 2B comes from step 4 (assay) and analysis 2 (mixed model)". If you cannot trace a panel back to a step, one of three things is true: the Methods are incomplete, the panel does not belong, or the analysis was not described.
Use identical labels in both places. If the workflow calls a group "treated" and the figure calls it "intervention", readers will wonder whether they are the same.
Step 4: Write Results around the figures
With the map in place, each Results subsection becomes: what was compared, what the figure shows, and the key quantity with its uncertainty. Order subsections by the logic of the argument. Describe what is seen before interpreting it; interpretation belongs in the Discussion unless your target journal combines the two.
A reusable paragraph pattern:
- one sentence stating the question the panel answers
- one or two sentences giving the result, referring to the panel
- one sentence linking to the next result
Step 5: Draft the Introduction and Discussion last
With evidence settled, the Introduction only has to build the gap that the evidence fills, and the Discussion only has to interpret findings that exist. Introduction: context, gap, objective. Discussion: the main finding, how it relates to earlier work, limitations, and implications. Each limitation in the Discussion should correspond to something visible in the map, such as a small sample, a missing control, or an unmeasured variable.
Step 6: Polish the figures
Once the structure holds, finalize the figures: consistent typography, a restrained palette, readable sizes, and complete legends. For multi-panel figures, assembling panels in a layout workspace keeps spacing and labels consistent. For posters and conference versions of the same story, a poster generator can reuse the same figures.
Step 7: Run a final consistency check
Read the manuscript with a checklist rather than as prose.
- Numbers: sample counts and key values agree between Abstract, Results, figures, and tables
- Units: identical everywhere
- Terminology: one name per concept throughout
- Legends: each figure legend explains every symbol, abbreviation, and error bar
- Citations: each figure is cited in the text, in order, and borrowed material is credited
- Claims: the Abstract and Discussion claim nothing the Results do not show
- Methods coverage: every analysis behind a figure is described
Read the Abstract last against the finished figures. It is the part most likely to have drifted during revisions.
Common mistakes
- writing the Introduction first and then trying to make the data fit it
- reporting results in the order experiments were done instead of the order that best supports the argument
- figures that need three paragraphs of legend to be understood
- changing a term or a sample number in one place but not in all places
A figure-first approach is not a rigid rule; some fields have standard section orders and journal templates. But even then, mapping evidence to figures before drafting makes the final paper easier to write, review, and revise.
Plan four panels without turning them into four claims
For an illustrative study of a membrane coating, a useful figure plan is: A, apparatus and sample preparation; B, a representative surface image with acquisition details; C, the measured outcome across independent samples; D, a proposed mechanism clearly labelled as a schematic.
Panel B cannot establish the group effect by itself, and panel D is an interpretation rather than another measurement. Draft the results paragraph around panel C’s actual analysis. Use B to show the kind of material examined and A to explain how it was produced. In Discussion, state which features of D are supported and which remain a hypothesis.
This gives each panel a job. If the paper has no evidence for a proposed transport pathway, remove that pathway from D or show it explicitly as hypothetical. Adding a vivid arrow does not strengthen the evidence behind it.