
Scientific Infographic Design: A Complete Guide for Researchers and Educators
Plan, design, review, and export accurate scientific infographics with clear layouts, honest data visualization, citations, and accessibility.
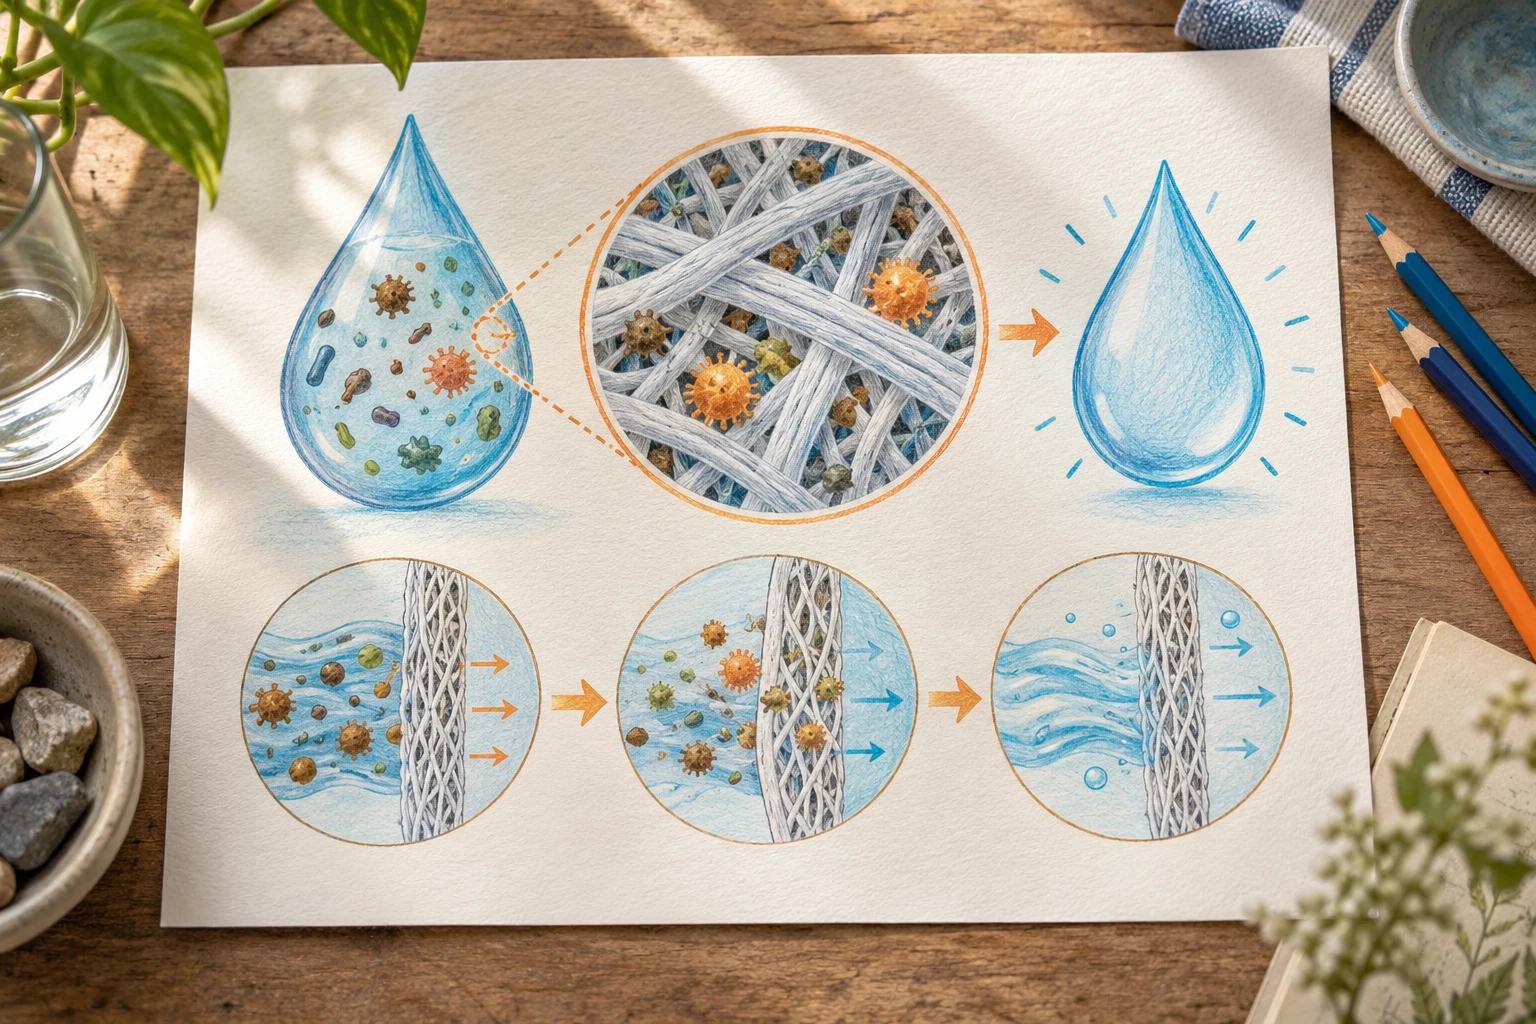
A scientific infographic is a compact visual explanation of research findings, a concept, or a process for readers who will not read a full paper. It succeeds when one main message sets the reading order, the evidence hierarchy, and the amount of detail. It fails when it tries to be a poster, a paper abstract, and a decoration all at once.
Define the audience and message
Start with words, not shapes. Write down:
- Audience: other specialists, students, funders, patients, the public? This decides vocabulary and how much background to supply.
- Main message: one sentence, stated as a conclusion rather than a topic. "Sleep restriction impairs memory consolidation" is a message; "sleep and memory" is a topic.
- Supporting facts: the two to four findings or data points that justify the message.
- Required labels, units, and citations: gathered now so they are not forgotten later.
- Where it will be seen: social media, a slide, a printed handout, a journal graphical abstract, a poster section. Channel decides size, text length, and format.
If a stakeholder wants more content, ask which sentence it supports. Material that supports no sentence belongs in the caption or in a link to the full source.
Choose an honest structure
| Purpose | Structure | Watch out for |
|---|---|---|
| Change over time | Timeline | Uneven intervals drawn as even ones |
| Alternatives or groups | Comparison columns | Unequal criteria across items |
| Sequence of steps | Process flow | Arrows that imply more than the evidence |
| Parts of a whole | Labeled diagram or proportional chart | Shares that do not add up |
| Quantities | Chart | Choose a chart only if you have real data |
Charts deserve special care. Start axes honestly, keep scales consistent between panels you want compared, show uncertainty where the original study reports it, and never size icons in a way that exaggerates a difference. If you cannot represent a number accurately in the space available, state it in text.
Build a layout with a reading path
Readers scan before they read. Create a path they can follow without instruction.
- Title: the message, in plain language.
- Entry point: the largest or highest-contrast element, usually the key finding or the central diagram.
- Body: two to four blocks in a clear order (top to bottom or left to right), separated by whitespace.
- Source line: citations, dataset or study identifiers, and the date.
Use a grid, align edges, and give related items the same treatment. A good test is the squint test: if you blur your eyes, the structure and the most important element should still be apparent.
Typography, color, and icons
- Limit yourself to one or two typefaces and a small set of sizes for title, heading, body, and caption.
- Keep body text short; fragments and direct labels work better than paragraphs.
- Choose a restrained palette with fixed meanings, for example one color for the treatment and one for the control, used identically everywhere.
- Use icons or illustrations when they carry information, such as showing an organ or an instrument, and avoid generic clip art that adds noise.
- Do not rely on color alone; pair it with labels, shape, or position.
Write precisely and cite
Short text still needs to be correct. Use the same terms as the source, keep units, and mark uncertainty honestly ("associated with" is not "causes"). For each number or claim, be able to point to its source. Put sources on the graphic itself, or in an accompanying caption, in a form readers can follow. If you adapt another group's figure, check the reuse conditions and credit it.
Review accuracy and accessibility
Run two separate reviews.
Accuracy review
- Check each number against the source
- Check that the message does not go beyond what the study supports
- Confirm names, units, and abbreviations
- Ask a domain expert or the study's author to read it, if possible
Accessibility review
- Text is large enough at the final size and has strong contrast with its background
- Information does not depend on color alone
- Reading order makes sense when linearized
- Provide alt text or a text version for web publication, summarizing the message and key data
Export for the channel
| Channel | Considerations |
|---|---|
| Print or poster | Vector output where possible, enough resolution for any raster images, bleed and margins as required |
| Slides | Match the slide ratio, and keep text editable |
| Web or social | Size for the platform, compress images sensibly, and check how it crops in previews |
| Journal graphical abstract | Follow the journal's size and format instructions exactly |
An editable source makes reuse simple. In FigEditor, you can generate a first draft from your research text, refine it in the SVG editor, and export to editable PPTX for slides, or arrange several parts in the figure layout workspace. Always review a generated draft against the source before sharing.
Final checklist
- The message is a one-sentence conclusion
- Every element supports that message
- The structure matches the type of information
- Charts are honest in scale and axes
- All numbers and claims are traceable to cited sources
- Text is readable and contrast is strong
- The graphic works without relying on color alone
- Export format and size fit the channel
- An editable source file is saved
An infographic is finished when a reader can state the message back to you after a quick look, and when you can defend every number on it. For more on figure types, see the scientific visualization guide.
Build one infographic around a single numerical comparison
Suppose you are communicating an illustrative water-use audit: 60 units for process A, 30 for B and 10 for C, totaling 100. Start with the sentence “Process A accounts for 60% of measured use.” A horizontal bar chart communicates that comparison directly. If you use droplets as repeated units, give each droplet the same value and explain the key.
Do not make one droplet twice as tall and twice as wide to mean twice the water: its area becomes four times as large. Keep the source period and measurement boundary next to the chart. A facility-level total cannot automatically be described as a per-person result.
A working hierarchy is a short headline, one dominant quantitative chart, a three-step process explanation beneath it, and a source note. Remove decorative facts that do not help explain the 60/30/10 split. This is easier to read than a page where every icon competes to be the main message.