
AI Figures in Journals: Separate Schematics, Data Plots and Research Images
A four-panel manuscript example turns publisher policies into a concrete provenance, disclosure and reproducibility review.
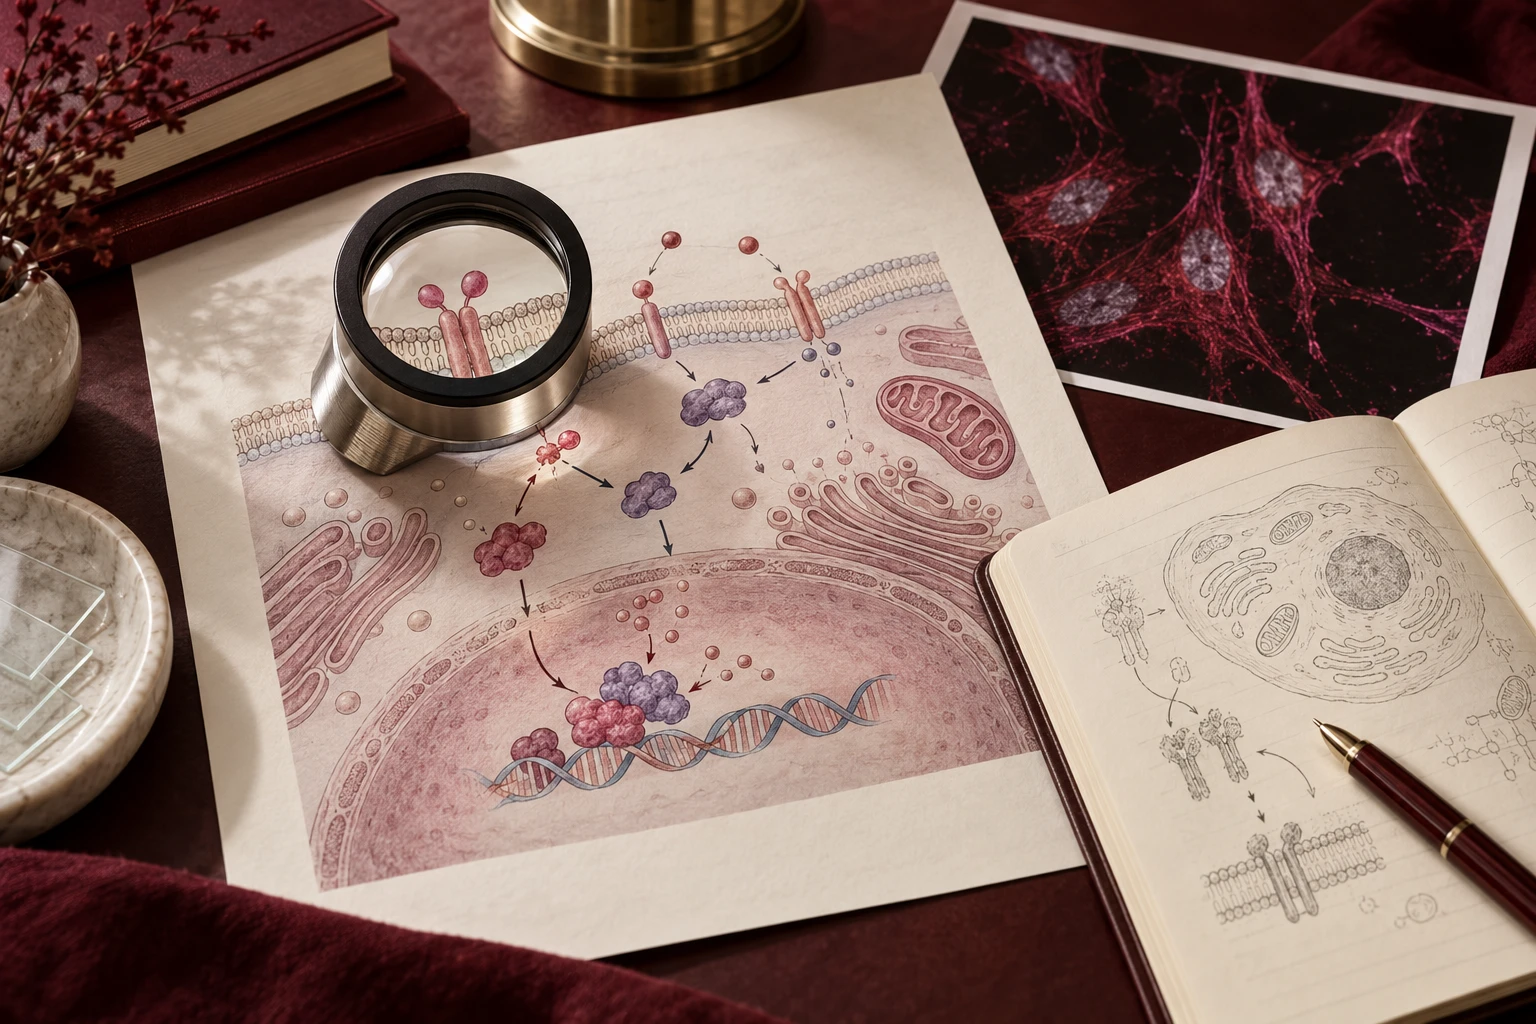
“Can I publish an AI figure?” is too broad. A conceptual pathway, a reproducible scatter plot and a microscopy image represent different kinds of evidence. Review the actual panel and the target journal's current rules rather than treating all images as one category.
Classify a four-panel example
Consider a paper with a conceptual treatment workflow, a scatter plot of measured response, a microscopy panel and a graphical abstract. Record the source of each before using any image tool.
| Panel | Source of truth | Appropriate verification |
|---|---|---|
| Treatment workflow | Validated experimental description | Objects, sequence, labels, unsupported implications |
| Scatter plot | Actual data and analysis code | Re-run values, axes, grouping, exclusions |
| Microscopy | Original acquisition and permitted processing | Provenance, processing record, image-integrity requirements |
| Graphical abstract | Approved scientific interpretation | Journal-specific policy and accurate summary |
This is a classification method, not a statement that every journal accepts each use.
Read current policy, not an old blanket rule
Checked on 11 October 2026, Elsevier's journal policy distinguishes explanatory images, data-derived visualizations and primary research images. Its guidance allows certain explanatory uses with human verification and disclosure, requires reproducibility for data visualizations and prohibits fabricating or altering primary experimental imagery with generative tools. Graphical abstracts have additional conditions. Read the specific journal's instructions as well.
Nature's AI policy presents a risk-based framework centered on human accountability, verification and transparency. Do not substitute a remembered slogan for the current journal-specific rules. Save the policy URL and review date with your submission notes, and ask the editor about an ambiguous panel before building a workflow around it.
Keep illustrations away from the data source
For the scatter plot, produce coordinates and statistics from the analysis pipeline. If AI helps write code, review and run the code against the actual dataset; inspect transformations, missing-value handling and exclusions. A generated image of plausible dots is not a data visualization.
For microscopy, retain the original acquisition files and processing record. Do not use an image generator to remove artifacts, fill missing tissue or create a cleaner-looking observation. A cartoon illustrating the microscopy method belongs in a separately labeled schematic, not in the evidence panel.
Make disclosure specific enough to audit
A useful draft disclosure might be:
A conceptual workflow draft was prepared using [tool and actual version/date].
The authors checked the stage order, labels and relationships against the
experimental protocol and revised [specific elements]. No experimental data
or primary research images were generated or altered by this tool.
This is a template, not a claim about your project. State only what actually happened and adapt it to the journal's required caption, Methods and disclosure locations. A blanket “AI was used” is less informative than a truthful account of the stage and scope.
Archive enough to reproduce the review
Keep the actual prompt, input references, tool/model information actually supplied, original output, edited master and approved final version. Mark illustrative drafts as such. Do not claim a version or seed that the tool never exposed. Record the scientific reviewer and the changes they required.
FigEditor's generation workspace can produce explanatory drafts and Figure Layout can combine reviewed panels. Neither a tool's publication statement nor a paid subscription overrides a journal's policy or validates the science. Acceptance depends on the actual panel, its provenance, the disclosure and the destination's current requirements.