

Comparisons
Compare AI Figure Credits by Cost per Finished Figure
A worked spreadsheet example separates subscription fees, generation attempts, revisions and manual cleanup so credit balances become useful budget numbers.
Practical guides, product updates, and better workflows for creating clear, editable scientific figures.
A worked spreadsheet example separates subscription fees, generation attempts, revisions and manual cleanup so credit balances become useful budget numbers.
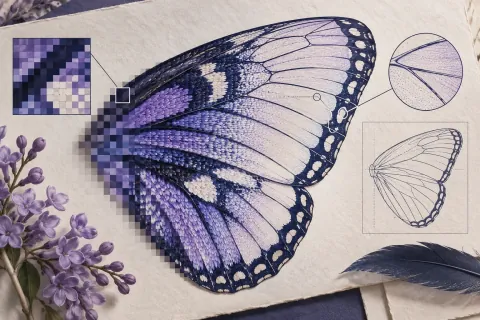
Recognize embedded bitmaps, outlined labels and true text, then repair a scientific diagram without assuming the file extension guarantees editability.

A six-person lab example turns a fixed budget into a workable combination of plotting, illustration and panel assembly.

Separate illustration, labels and connectors, choose a practical import route, and test a real slide revision before handing off the deck.
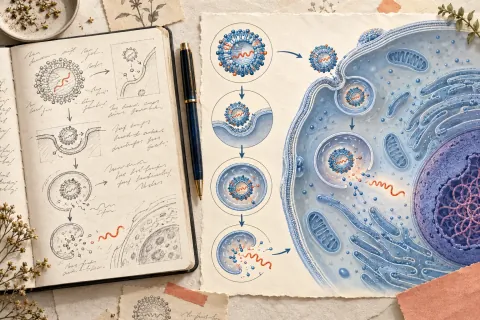
Build a microfluidics diagram from a structured brief, distinguish flow from causality, and revise one relationship without redrawing the whole figure.
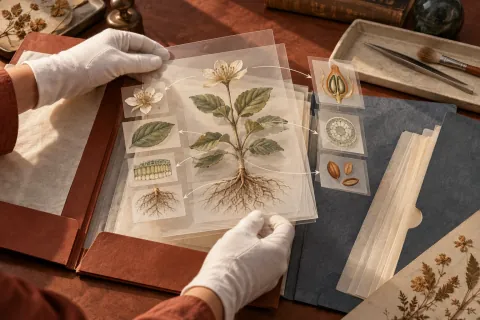
Inventory source files, test one representative import, and verify object structure before moving a collection of research figures.

Define the question, relationships, labels, and review steps before generating a scientific diagram in FigEditor.

Build a revision workflow with SVG masters, native PowerPoint objects, independent images, and honest export checks.

Definition of terms in research with a thesis-ready format, five examples, an operational definition template, and practical quality checks.
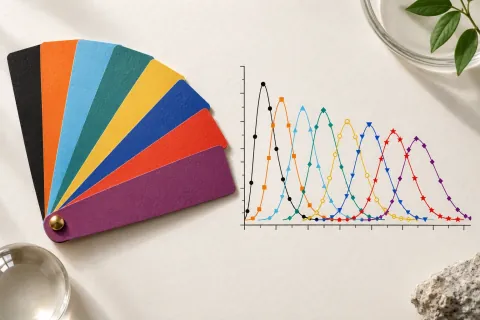
Use this Okabe Ito palette reference to copy all 8 hex and RGB values, add them in Python, R, MATLAB, and CSS, and check accessibility limits.

A practical, source-grounded workflow for research paper diagrams: define the claim, choose a structure, verify accuracy, and export a journal-ready file.

Use a scientific diagram maker to create a labeled lesson, simplified handout, unlabeled quiz, and answer key from one verified visual.