
Guides
Research Methodology Diagram: A 6-Step Guide for Papers
Turn a Methods section into a clear, editable workflow that helps reviewers follow inputs, procedures, decisions, and outputs.
Practical guides, product updates, and better workflows for creating clear, editable scientific figures.
Turn a Methods section into a clear, editable workflow that helps reviewers follow inputs, procedures, decisions, and outputs.

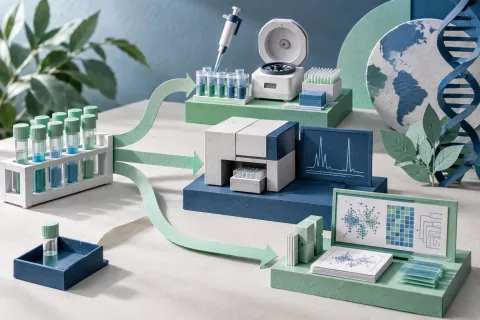
Create a four-stage sample-preparation diagram with open assets, editable labels and a compact provenance manifest.

A figure-first IMRaD workflow that links research questions, methods, figures, results, and discussion, with a final manuscript consistency check.

Plan, design, review, and export accurate scientific infographics with clear layouts, honest data visualization, citations, and accessibility.
How to compare Illustrae and FigEditor on figure generation, structured SVG editing, version history, export formats, pricing, and research workflow.

How to compare ConceptViz-style tools and FigEditor on editable SVG, label revision, version history, poster workflows, and total iteration cost.
A microfluidic-chip example separates missing assets from editing problems and shows how to preserve a useful fallback master.
A step-by-step way to compare FigureLabs and FigEditor on SVG editing, revision effort, exports, cost, and research workflow fit.