
Guides
Compare Graphical Abstract Tools with a One-Message Brief
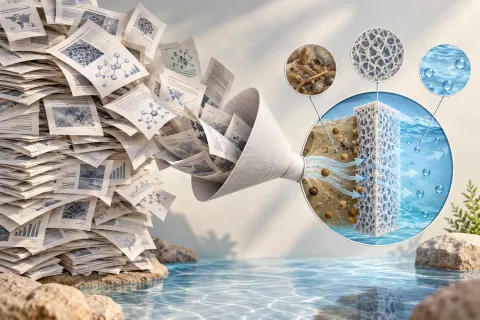
Turn a filtration study into one visual sentence, keep the measured result separate, and test whether a generator preserves the message through revision.
Practical guides, product updates, and better workflows for creating clear, editable scientific figures.
Turn a filtration study into one visual sentence, keep the measured result separate, and test whether a generator preserves the message through revision.

Use a fixed receptor diagram and three object-level edits to distinguish a usable scientific SVG from a flattened or impractical export.

Compare tools with a controlled membrane diagram, a materials cross-section and a multipanel workflow, using specific pass conditions rather than attractive examples.

Match labels, relationships, source material and revision requirements before comparing visual styles.

Compare asset assembly, manual vectors and generated drafts using a two-panel membrane experiment and a scored correction task.

Search an organ, a cell and a laboratory instrument separately, then audit meaning, editability and source records before assembling them.

A worked three-month manuscript budget separates subscription charges, revisions, figure count and the publication paperwork.
Evaluate the same revision tasks and delivery files before choosing where to build and maintain a research figure.

A four-panel manuscript example turns publisher policies into a concrete provenance, disclosure and reproducibility review.

Work through a lab-meeting, poster and journal example, with a practical version-and-permission record for the final file.
Separate scientific content, panel assembly and exported-file review instead of treating a polished layout as a finished figure.

Check each claim and object in a generated draft rather than equating visual polish with scientific readiness.

Build a small, low-cost workflow for one thesis mechanism and compare it with a deadline-driven paid option.

Evaluate supported objects, panel assembly and the receiving workflow instead of choosing from a thumbnail alone.
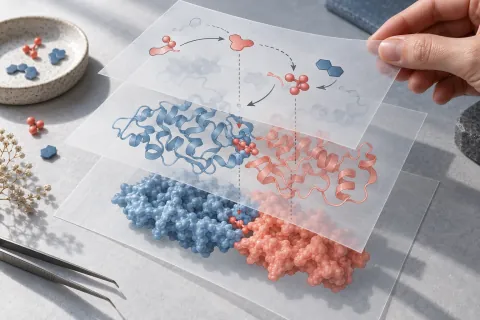
Compare the editable master, revision controls and receiving application before selecting a generation workflow.
Read the current operation costs, inspect the delivered objects and record the review work still required.

Use a common revision task to inspect documented exports, actual objects and collaborator requirements.
Work through a mixed-source figure, keep a small attribution ledger and spot the difference between free software and reusable artwork.
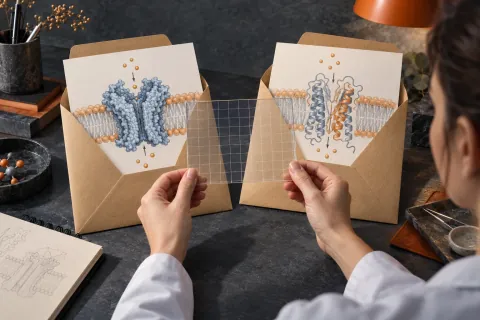
Keep the brief fixed and evaluate terminology, relationships, revisions and the actual delivered file.
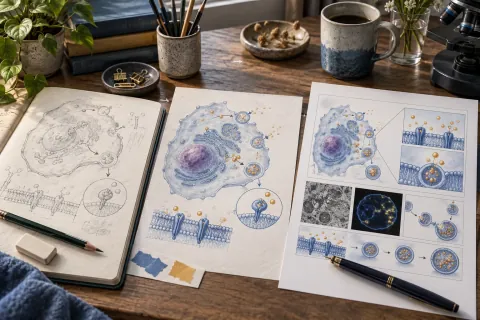
Plan panels, labels and evidence before generating a visual draft, then keep a reviewable master for revisions.
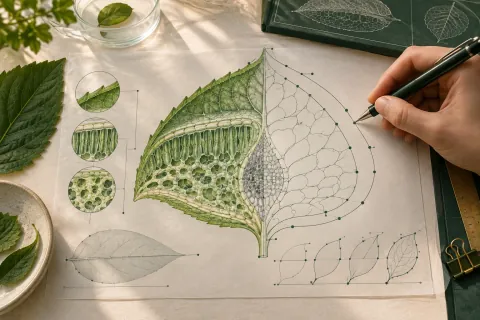
Keep a working SVG, test text and geometry separately, and review exported copies in the receiving application.
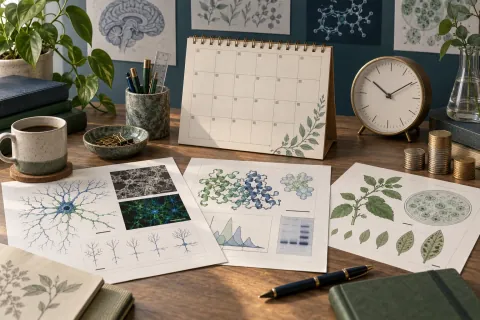
Use two timed figure trials and an explicit break-even equation to decide whether a paid illustration workflow earns its cost.
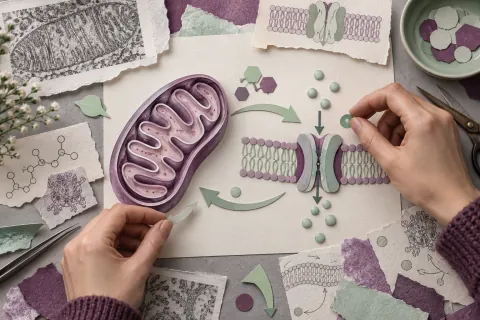
Check the delivered format and actual object structure before moving a figure between design tools.

A neuron-culture slide example shows how to compare a downloadable drawing with a slide-based asset workflow without assuming everything is free.
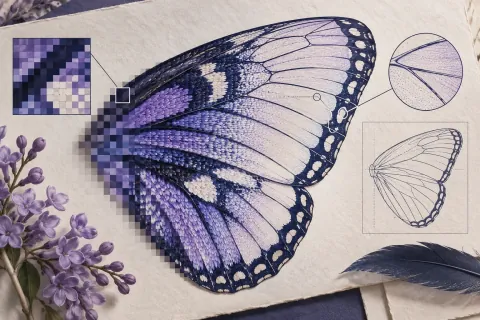
Recognize embedded bitmaps, outlined labels and true text, then repair a scientific diagram without assuming the file extension guarantees editability.

A six-person lab example turns a fixed budget into a workable combination of plotting, illustration and panel assembly.

Separate illustration, labels and connectors, choose a practical import route, and test a real slide revision before handing off the deck.
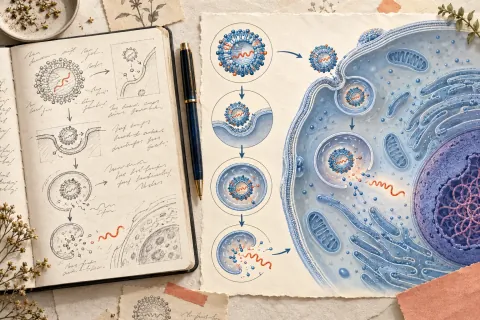
Build a microfluidics diagram from a structured brief, distinguish flow from causality, and revise one relationship without redrawing the whole figure.
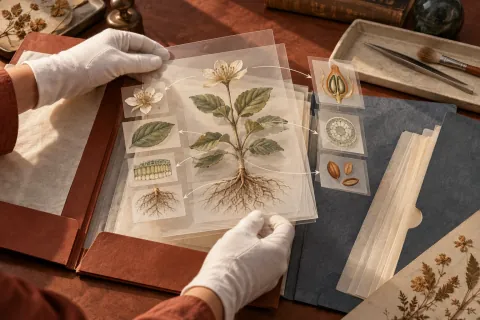
Inventory source files, test one representative import, and verify object structure before moving a collection of research figures.
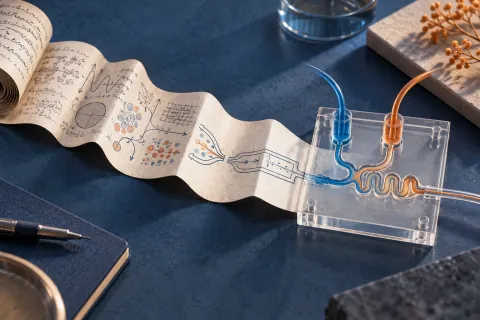
Define the question, relationships, labels, and review steps before generating a scientific diagram in FigEditor.

Build a revision workflow with SVG masters, native PowerPoint objects, independent images, and honest export checks.

Definition of terms in research with a thesis-ready format, five examples, an operational definition template, and practical quality checks.
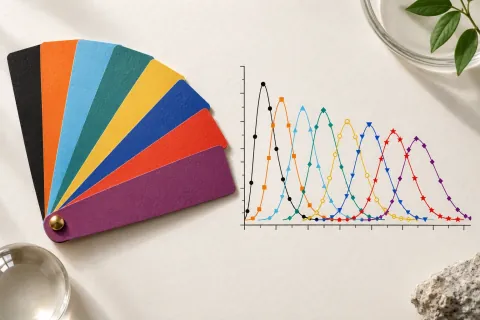
Use this Okabe Ito palette reference to copy all 8 hex and RGB values, add them in Python, R, MATLAB, and CSS, and check accessibility limits.

A practical, source-grounded workflow for research paper diagrams: define the claim, choose a structure, verify accuracy, and export a journal-ready file.
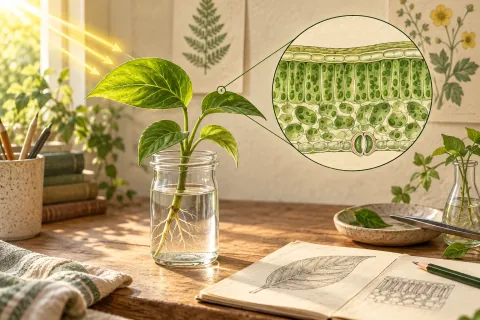
Use a scientific diagram maker to create a labeled lesson, simplified handout, unlabeled quiz, and answer key from one verified visual.
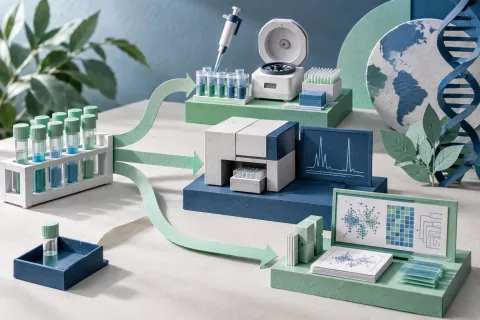
Turn a Methods section into a clear, editable workflow that helps reviewers follow inputs, procedures, decisions, and outputs.

A figure-first IMRaD workflow that links research questions, methods, figures, results, and discussion, with a final manuscript consistency check.

Plan, design, review, and export accurate scientific infographics with clear layouts, honest data visualization, citations, and accessibility.